technology Related Articles
Stay Ahead with Expert Electronics Insights,
Industry Trends, and Innovative Tips
- Electronic Components
- News Room
- General electronic semiconductor
- Components Guide
- Sort by
- Robots
- Transmitters
- Capacitors
- IC Chips
- PCBs
- Connectors
- Amplifiers
- Memory
- LED
- Diodes
- Transistors
- Battery
- Oscillators
- Resistors
- Transceiver
- RFID
- FPGA
- Mosfets
- Sensor
- Motors, Solenoids, Driver Boards/Modules
- Relays
- Optoelectronics
- Power
- Transformer
- Fuse
- Thyristor
- potentiometer
- Development Boards
- RF/IF
- Semiconductor Information
- Sensors
- PCB
- transistor
IntroductionUSB technology has become central to digital connectivity. Originally developed to standardize connections between computers and peripherals, USB has undergone several major updates over time to meet the increasing data demands of electronics. From the faster speeds of USB 2.0 to recent iterations like USB 3.0 and USB-C that support higher wattages and reversible plug orientations, each new version of USB aims to ease connectivity issues further. As an industry-wide standard, USB removes the need for specialized ports and cables across devices. For semiconductor and electronics manufacturers, supporting the latest USB standards ensures their products can integrate with the extensive USB device ecosystem. The continual improvement of USB technology highlights how industry collaboration helps hardware adapt to evolving computational needs. USB 2.0: The Widespread StandardWhen USB 2.0 arrived in 2000, it represented a significant leap forward. Boasting transfer speeds up to 40 times faster than the older 1.1 ports, USB 2.0 set a new benchmark with its 480 Mbps rate. At the time, this felt incredibly fast, almost like a lightning-speed standard. It's interesting to note how what was once considered groundbreaking is now seen as moderately paced in our current technological landscape. But beyond just being really fast, USB 2.0 nailed the user experience. By keeping backward compatibility and the same plug shape as the old USB, the new ports slid seamlessly into existing hardware and devices. That wide adoption was helped by USB 2.0 powering everything from printers and scanners to external storage with ease. Even today, it handles most keyboards, mice, webcams, and moderate file transfers just fine. Can't underestimate how important not rocking the boat was back then to make USB 2.0 succeed. These days, it may take that incremental update process for granted in tech. USB 3.0: The SuperSpeed RevolutionUSB 3.0's 2008 debut marked a revolutionary data transfer tech shift. At an impressive 5 Gbps, over ten times quicker than USB 2.0, USB 3.0 exceeded expectations and rapidly became the undisputed new standard, blowing past USB 2.0 speeds. This rapid advancement, aptly named "SuperSpeed USB," made previous speeds seem sluggish in comparison. On a technical level, USB 3.0 also significantly improved power delivery, now supporting up to 900mA device charging. In order to facilitate substantial functionality and capability enhancements, the new USB 3.0 specification made use of high-performance cabling and connector designs while retaining backward compatibility with USB 2.0, highlighting the criticality of interoperability across standards revisions. The impact of the improved bandwidth and throughput capabilities of USB 3.0 became most evident for external storage solutions and SSDs, facilitating major gains in performance. The standard also provided tremendous benefits for bandwidth-hungry applications like high-def video editing and PC gaming that deal with massive data transfers. USB-C: The Future-Proof ConnectorUSB-C has recently taken over as a game-changing upgrade for USB tech. This total redesign brings way more than incremental improvements - its reversible connector single-handedly solves those aggravating upsizing plug insertion struggles, ushering in an age of plug-in convenience. But easy plugging is just the start - USB-C is a shockingly versatile all-in-one powerhouse, transmitting data, power, video, and audio over a single cable. Earlier USB versions couldn't touch this level of multifunctionality. Pair USB-C with the high-speed USB 3.1 or the even faster USB 3.2 to achieve transfer speeds ranging from 10 to 20 Gbps, significantly surpassing the performance of older USB 2.0 and 3.0 standards. This level of high throughput is crucial for efficient data handling and rapid communication between devices, especially in semiconductor industry applications where large data volumes and high-speed data exchange are required. The power delivery capacities of USB-C are just as impressive. Capable of delivering up to 100 watts of power, this single standard can easily power even full-fledged laptops - yet also handles charging something as small as a smartphone. That's versatility. With capabilities spanning small devices to power-hungry computers, it makes perfect sense that USB-C is becoming the ubiquitous go-to cable for phones, tablets, and laptops alike. Moreover, by supporting protocols like HDMI, USB-C takes the functionality of docking stations to the next level. Single-cable USB-C hubs can now connect displays, input devices, expand storage, and control networking - it's fast becoming the only cable you need. More than an incremental upgrade, USB-C represents a giant leap ahead for simplified connectivity and interoperability. Direct Comparison of USB 2.0, USB 3.0, and USB-CSpeed:It's no contest, really. USB 2.0 brought decent 480 Mbps speeds, but it feels positively pokey nowadays. USB 3.0 pumped things up to a respectable 5 Gbps. Still, both look snail-paced compared to USB-C paired with 3.1 or 3.2, pushing up to 20 Gbps! It dusts the rest.Power:Don't need to juice more than a basic mouse or keyboard? The old USB standards work fine. But is anything power-hungry like a laptop? You want USB-C's insane 100-watt capabilities that crush the others.Compatibility:USB 2.0 and 3.0 connectors remain prone to hooking things up upside down. Super annoying! USB-C being reversible eliminates that headache outright. Such a simple change, but so useful.Functionality:The main thing here is that USB-C goes way beyond old USB standards in what it can do. Protocols for video, audio, data, charging - it can handle them all in one cable. That flexibility to replace a huge rat's nest of ports and wires is invaluable. So, while the old USB formats still have niche use cases today, it's clear that USB-C represents the future. It leaves its predecessors in the dust across the board - power, speed, convenience, versatility. Any way you slice it, USB-C wins out. Future OutlookUSB's evolution shows how the semiconductor biz is always hustling to make electronics faster, more flexible, and tightly integrated. Peering into the future, we can see a bunch of tech trends working together to mold the next iterations of USB protocols. While the standards get an upgrade, the goal remains the same - make devices communicate and operate better. 1. Increased Data Transfer Speeds:USB standards will offer faster transfer rates, with USB4 promising up to 40Gbps data speeds rivaling Thunderbolt 3. This leap enables high-bandwidth applications like VR, video editing, and big data analytics. 2. Enhanced Power Delivery:More power-hungry devices require improved power delivery capabilities from USB ports for faster charging. Future standards will boost power to support additional gadgets like laptops and some household appliances - further establishing USB-C as a universal charging standard. 3. Wireless USB:While versatile, cables remain limiting. Emerging wireless USB technologies provide the freedom of Bluetooth with USB data rates - ideal for clutter-free workspaces. 4. Improved Data Security:With data breaches rising, security is critical. Future protocols will integrate advanced encryption and access control to better guard sensitive information on USB devices against theft and unauthorized access. 5. Sustainability and Environmental Considerations:As sustainability gains prominence, USB standards could shift to ecologically friendly manufacturing, recyclable materials, and energy-efficient operation per tech industry environmental goals. 6. Broader Industry Integration:USB will embed deeper into automotive, healthcare, and other sectors - not just enabling data transfers but integrating power delivery, diagnostics, and control systems, too. This makes USB an increasingly essential technology. ConclusionAs USB has progressed, from initial USB 2.0 to cutting-edge USB-C now, steady enhancement of standards persists. Despite incremental changes, the core goal remains faster speeds and connectivity. Once game-changing, USB 2.0 sets the bar; each iteration aims to push it higher. The format evolves, yet USB's ethos stays unchanged - data transfer and communication bridge devices drive innovation. Today, it remains quite effective for lower-demand applications such as mice and keyboards, where ultra-high speeds are not a necessity. Then came USB 3.0, introducing a significant advancement in data transfer capabilities. This standard greatly enhanced the performance of external drives and made handling high-resolution videos more feasible, marking an important evolutionary step in USB technology. USB-C, however, represents a more dramatic shift. This standard sets itself apart in terms of speed, power delivery, and versatility. Its comprehensive capabilities extend far beyond what previous USB standards offered, positioning USB-C as a formidable force in the realm of connectivity. Other standards in the industry might indeed take note of how effectively USB-C manages a diverse range of functions.
Allen On 2024-01-24
Overview: This article discusses the challenges faced by smart grids. It also briefs on how the Energy Internet and the use of blockchain and IoT technologies are potential solutions to smart grid security challenges. A decade ago, the idea of a "smart grid" was the foundation of bright dreams, now, it's the most talked-about issue in the industry of renewable sources. The smart grid is a multidimensional energy infrastructure idea that can be implemented using a wide range of available technologies. The incorporation of a "smart grid" into today's electrical infrastructure is crucial for the following reasons: What are the challenges faced by smart grids?Skepticism Among Industries First of all, industries are still hesitant about the advancement of smart grid projects. The misconception among industries is that government commitments cannot be fulfilled and that smart grid projects are moving slowly forward. Furthermore, despite the fact that governments fund the creation and testing of smart grid pilot projects, the industries engaged in the installation of these projects have little passion for investing in the technology, which has an impact on the system's development. Security Issues Second, there are numerous security risks and associated difficulties that can affect the architecture and infrastructure of smart grids. Threats and difficulties include terrorism, theft, disasters caused by nature, and cyberattacks. An actual security breach may result inPower outagesA breakdown in the information and technology infrastructureDisruption in the power marketNetwork cascade failureEndanger human safety In summary, issues with technology privacy, permission, and authentication are identified as smart grid security challenges. The Energy Internet may also have similar problems, but using technologies like blockchain and the Internet of Things (IoT) should make security breaches less likely and less harmful, and they should also make recovery easier with little assistance from humans. Decreased Penetration of Electric Vehicle Thirdly, a barrier to the widespread use of electric vehicles in the energy sector is the low market penetration of these vehicles with vehicle-to-grid (V2G) capability. Repeated charging and discharging of the battery is necessary for effective V2G operation, which results in battery deterioration. Even though scientists are optimistic about lithium-ion (LFP) batteries, more study is needed to determine how to maximize the battery life of V2G-enabled vehicles for the technology to be implemented effectively. Complexities Posed by Microgrid Fourth is using micro-grids to improve smart grids. The installation of microgrids with smart grids presents few technological and regulatory hurdles. Inbalanced supply and demand can lead to issues with frequency and voltage in microgrids. When generators are connected and disconnected using a "plug-and-play" feature, these issues may worsen. Variations in the power production from the connected renewable energy systems make it difficult to maintain a steady state for the microgrid. Furthermore, a greater proportion of renewable energy could cause transmission and distribution difficulties in the current network. The incorporation of suitable protection devices becomes essential as the system becomes more complicated. Because micro-grid infrastructure comprises a bi-directional power flow, the protection mechanism differs from standard power systems. Additional information on micro-grid protection schemes should also be considered. Development of Strandards Lastly, it is necessary to address the issues raised by the regulation of communication devices, cyber-security devices, and compatibility and conformity to standards. Countries have assigned various groups the task of creating standards for smart grid interoperability. The design, development, and production of devices that meet international standards is one of the main obstacles to deploying smart grid infrastructure. The Energy Internet The Energy Internet is allegedly able to solve many of the aforementioned problems. It serves as the energy system's forthcoming revolution. It will make it possible to put less focus on large-scale centralized power generation and more on numerous tiny, dispersed generation systems. Government investment in generating facilities may be minimized as a result of prosumers now owning a larger portion of the power generation industry. Households and other small-scale users who can construct local power plants to buy and sell electricity are encouraged to invest via the Energy Internet. By doing this, governmental organizations' investment burden is lessened when they spend on building infrastructure. It provides advanced capabilities to facilitate flawless electricity exchange through the Energy Internet. Current security threats and challenges are addressed when this infrastructure is supported by innovative technologies like blockchain and IoT. However, as technology develops, new security threats are probably going to appear, and ongoing cybersecurity innovations are going to address them. Research in the field of Energy Internet helps optimize storage devices to reduce battery wear. The Energy Internet can also use distributed energy systems management algorithms to best address ongoing smart grid issues brought on by the unpredictable and variable nature of renewable energy systems. Future integration of artificial intelligence (AI) and machine learning (ML) algorithms into the Energy Internet, which provide additional support. Lastly, government agencies must coordinate with other relevant international entities to address the concerns of standardization and interoperability. Energy Internet can fill up the gaps left by the smart grid's shortcomings. Management of Energy Internet Markets The markets for green gas, liquid fuels, and renewable heating in the future will affect the power market. The Energy Internet has the ability to reconfigure itself into a multi-energy system in this regard. A fully operational energy market for the energy cells can be integrated into the Energy Internet architecture. As an illustration, the current electricity exchanges in some countries operate using an auction-based bidding system. This technique works well in static liberalized markets where it is simple to predict the market structure and network architecture. Energy cells that are integrated with the Energy Internet, however, are diverse in character and have competing objectives. Auction-based bidding might not be an effective market mechanism given this feature. Game-Theoretical Algorithms A real-time power price that reflects the dynamic supply and demand balance is one potential option. The selection of game-theoretical algorithms to establish an appropriate real-time pricing mechanism for trading among energy cells on the Energy Internet is one suitable option. Game theory models have been used to examine studies that deal with disagreements involving interactive decision-makers. In recent years, the scalability of game-theoretic algorithms has facilitated their widespread use in energy market design. The mathematical model for the day-ahead market for the competitive energy cells was developed using the Nikaido-Isoda function (NIRA) and the Relaxation algorithm. For more than three decades, businesses have relied on a specific group of numerical algorithms known as relaxation algorithms. Earlier efforts in the relaxation method greatly illustrate the technique's quick convergence and reasonable accuracy. The bilateral Shapley value and kernel are used to make sure that profits are shared fairly among consumers who work together. Blockchain Technology Virtually anything of value can be recorded in the blockchain, an uncorruptible digitally distributed ledger of economic transactions. The shared ledger that is published to every member is the foundation of how blockchain technology operates, as shown in Fig. 1. Fig. 1. Centralized transaction vs. blockchain transaction Source: IEEE Access It uses smart contracts to make sure that participants follow the rules, a distributed consensus method to make sure that everyone agrees on the proposal, and cryptography-based safety measures to make trade easier. As a result, it offers the customer a private cybersecurity solution that is strong and resilient. Additionally, blockchain reduces the possibility of double-spending that comes with digital currencies. The computation-intensive algorithm is necessary to mitigate the possibility of double-spending. New blocks are added to the blockchain, and transactions are validated using this computational technique. Specialists compete with one another to solve problems and validate these transactions. Additionally, blockchain offers attributes likeTransparency, which makes data easily auditable,Redundancy, which distributes a copy of data to all participants to prevent third-party malpractice,Immutability, which makes record alteration exceedingly difficult,Disintermediation, which does away with intermediaries like banks or energy utilities,Blockchain technology offers continuous traceability of all energy transactions as well as a comprehensive transaction record for the energy markets. But there are still some issues with the technology. Among the difficulties are those related toDigital data and metadata storageNetwork effect problemsCopyright disputesLegal concernsSummarizing the Key Points The Energy Internet can address ongoing smart grid issues brought on by the unpredictable and variable nature of renewable energy systems.Prosumers owning a larger portion of the power generation industry can minimize government investment in generating facilities.Blockchain and IoT technologies can make security breaches less likely and less harmful, and they should also make recovery easier with little assistance from humans.Disintermediation and blockchain technology offer continuous traceability of all energy transactions as well as a comprehensive transaction record for the energy markets.Difficulties related to digital data and metadata storage, copyright disputes, network effect problems, and legal concerns still exist with blockchain technology.Reference Joseph, Akhil, and Patil Balachandra. “Smart Grid to Energy Internet: A Systematic Review of Transitioning Electricity Systems.” IEEE Access 8 (2020): 215787–805. https://doi.org/10.1109/access.2020.3041031.
Rakesh Kumar, Ph.D. On 2023-10-24
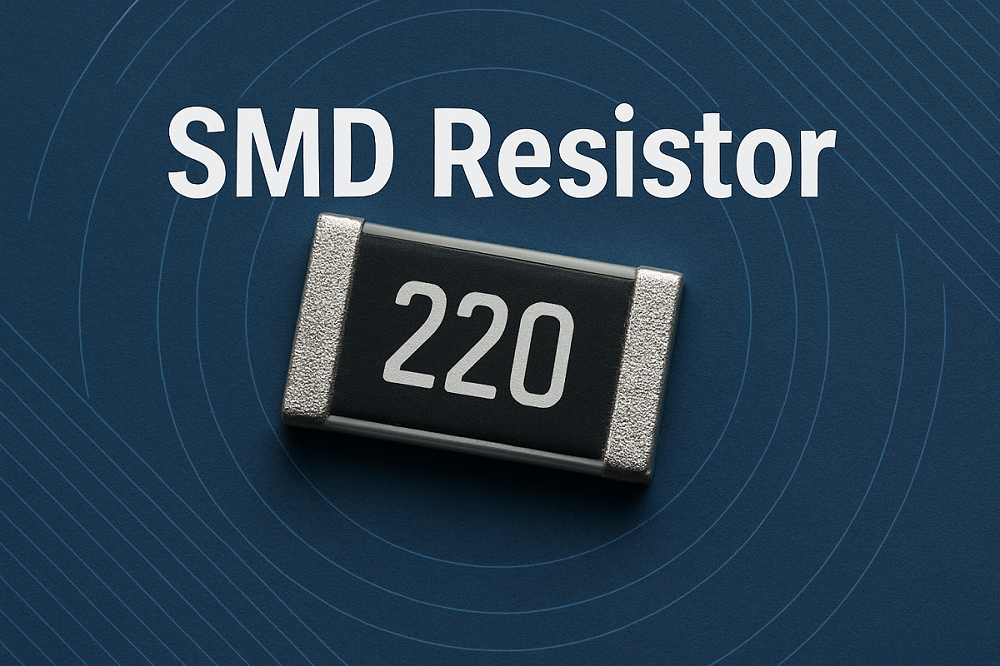
Catalog Resistors and Capacitors Electrolytic capacitors Transistor & diode packages Integrated circuit SMD packages Ball Grid Array Small Outline Packages Flat Packages Surface Mount Technology (SMT) is a technique for mounting electrical components directly to the surface of a printed circuit board (PCB). The component that is mounted on the surface of the PCB using surface mount technology is called Surface Mount Device (SMD). SMT has essentially replaced the through-hole PCB manufacturing technology to reduce cost, and increase efficiency and productivity. Since the size of SMD components is very small, compared to through-hole components many more SMD components can be arranged in a given place. Selecting and knowing the right SMD component for your PCB is very necessary. SMD components have standard codes and sizes which as a PCB designer one should know. Kynix offers all sorts of SMD components for PCB manufacturing which can be found here. This article will help you choose the right SMD component from the Kynix library. SMD components come in various packages and sizes to facilitate the automated manufacturing of PCBs. Most of the SMD components are standardized to make manufacturing easy. The most commonly used SMD components are capacitors and resistors. The standards of these components are set by Joint Electron Device Engineering Council. There are different types of packages. When a new package is introduced in the industry, it is named after its initials such as Quad Flat Package (QFP). While some packages have no name, it creates confusion in the industry. Below we have discussed flat chip SMD resistors, capacitors, diodes & transistors, and IC packages. The size of the SMD chip for resistor, capacitors, and some of the diodes is given by a 4 digits code, which represents the dimension of the flat chip either in inches or in millimeters. In the US it is represented in inches while outside the US it is represented in mm. The first two digits represent the length (L) of the component while the last two digits represent the width (W) of the component. While the thickness is also an important factor in manufacturing, it is not mentioned in the 4 digits code, for this, the actual datasheet of the component provided by the manufacturer should be used. Many PCB components such as resistors, capacitors, diodes, FETs, and other transistors are available in SMD. SMD resistors and capacitors, also known as passive devices, come in different sizes. Depending upon the availability of space, soldering capability, and environment temperature, different packages can be used. The names of these packages given in the table below are derived from the size of the components in inches. Resistors and Capacitors Below are the most common size codes for capacitors and resistors. You can find these resistors and capacitors here. S. NoPackageDimensions (in)12010.02x0.01220160.2x0.1632020.02x0.0242040.02x0.0452070.02x0.0763030.03x0.0373060.03x0.0684020.04x0.0294040.04x0.04104060.04x0.02115020.05x0.05125050.05x0.08135080.05x0.1145100.05x0.1156030.06x0.03166060.06x0.06176120.06x12187050.07x0.05198050.08x0.05208080.08x0.08218150.08x0.15228160.08x0.16238300.08x0.32410100.1x0.12510200.1x0.22610500.1x0.52712060.12x0.062812100.12x0.12912160.12x0.163012180.12x0.183112200.12x0.23212240.12x0.243312250.12x0.253414050.14x0.053515050.15x0.053615060.15x0.063715100.15x0.13815750.15x0.753916080.16x0.084016320.16x0.324118120.18x0.124220100.2x0.14320120.2x0.124420180.2x0.184520300.2x0.34622080.22x0.084724090.24x0.094824120.24x0.124925100.25x0.15025120.25x0.125125150.25x0.155226150.26x0.155327250.27x0.255427260.27x0.265527280.27x0.285628160.28x0.165728170.28x0.175828180.28x0.185930140.3x0.146030200.3x0.2 At present most manufacturers can manufacture PCBs with SMD components up to 0603 easily, going below this size to such as 0402 or 0201 is still difficult for the manufacturers, and thus the cost of manufacturing increases if these components are included in the design. Therefore, most of the manufacturers recommend using 0603 components for PCB design. Electrolytic capacitors The electronic industry adopted EIA and IECQ standards for molded tantalum capacitors. These packages are named A, B, C, D, and E. These correspond to different sizes in millimeters. Package height is not included in the size code. EIA codeMetric codeDimensionA32163.2 x1.6 mmB35283.5 x 2.8 mmC60326.0 x 3.2 mmD73437.3 x 4.3 mm Several other electronic devices can not follow any standard because of their unique nature. SMD components like an inductor, transformers, crystals, resonators, and temperature-controlled oscillators require different packages often larger than the standard packages. It is very unlikely that these packages will be standardized because of their unique nature. However, the package must be chosen in a way to make pick and place possible. These capacitors can be found here. Transistor & diode packages SMD transistors and diodes have the same package type. Transistors have three pins while a diode has two pins. The third pin is added to the diode package to keep the orientation right. Diodes are packages that come in different varieties. Some packages follow the standards of capacitors and resistors that we discussed above. Some of the most common diode and transistor packages are SOT-23 - Small Outline Transistor: It is the most common diode and transistor package. It has three pins and measures 3 mm x 1.75 mm x 1.3 mm. It is used for low-power applications.SOT-223 - Small Outline Transistor: This diode package is used for high-power applications. It is bigger than SOT-23. It measures 6.7 mm x 3.7 mm x1.8 mm. It has four pins with which the fourth one is used for heat dissipation. Integrated circuit SMD packages IC packages are found in many packages and can be classified in many different ways. It is very common to hear the terms DIP, SOP, SIP, TSOP, QSOP, MSOP, SOIC, QFP etc. These are the different packages of IC. They can be categorized as. There are three main package types for surface mount integrated circuits: Ball grid array (BGA)Small outline package (SOP)Quad flat pack (QFP) Ball Grid Array Ball Grid Array package has solder balls attached to the underside of the package. Beneath the balls are electrical traces of IC. Ball Grid Array has further the following types. Molded Array Process Ball Grid Array (MAPBGA)Plastic Ball Grid Array (PBGA) Thermally Enhanced Plastic Ball Grid Array (TEPBGA)Tape Ball Grid Array (TBGA)Package on Package MicroBGA. Small Outline Packages Small Outline Package is another IC package in which pins come out from the sides of the IC. The convention used for SOIC or SO package is the name followed by the number of pins used in the package. i.e SO-12 means the IC has 12 pins. Further types of SOP/SOIC are SOJ - Small Out-Line J-Leaded PackageTSOP -Thin Small Outline PackageVSOP -Very Small Outline Package).TSSOP -Thin Shrink Small Outline Package SSOP -Shrink Small Outline PackageQSOP -Quarter-size Small Outline Package Flat Packages Flat IC package have pins arranged on its side in L or J shape. These pins are arranged on the side of the package with the leads coming out. This package further has many subtypes. QFP (Quad Flat Package)TQFP (Thin Quad Flat Package)STQFP (Small Thin Quad Plastic Flat Package)FQFP (Fine-pitch Quad Flat Package),(Low profile Quad Flat Package)VQFP (Very-small Quad Flat Package)ETQFP (Exposed thin quad Flat Package)PQFN (Power Quad Flat Package)PQFP (Plastic Quad Flat Package)QFJ (Quad Flat J-Leaded Package)QFN (Quad Flat Non-Leaded Package)
Allen On 2022-11-29
Ⅰ IntroductionA motion sensor is a kind of security system. And the linchpin of your security system is a motion sensor (or motion detector) as it detects when someone is in your home who should not be there. A motion sensor detects movement in an area with one or more technologies.When a sensor detects motion, it sends a signal to the control panel of your security system, which is connected to your monitoring center. This notifies you and the monitoring center that there is a potential threat in your home.CatalogⅠ IntroductionⅡ Motion Sensor Related Video:Ⅲ What is a Motion Sensor?Ⅳ Types of Motion SensorsⅤ How do Active Ultrasonic Sensors and Passive Infrared (PIR) Work?5.1 Active Ultrasonic Sensors5.2 PIR SensorsⅥ How to Install a Motion Sensor?Ⅶ Other Uses for Motion SensorsⅧ FAQ Ⅱ Motion Sensor Related Video:How PIR Sensor Works and How To Use It with ArduinoMotion Sensor Video Description:In this Arduino Tutorial we will learn how a PIR Sensor works and how to use it with the Arduino Board for detecting motion. Ⅲ What is a Motion Sensor?A motion sensor (or motion detector) is a genre of electronic device that detects and calculates movement. We can often find motion sensors in the home and business security systems, as well as in phones, paper towel dispensers, game consoles, and virtual reality systems. Unlike many other types of sensors, motion sensors can not be handled and isolated as they are in embedded systems comprised of three major components: a sensor unit, an embedded computer, and hardware (or the mechanical component). Because motion sensors can be customized to perform highly specific functions, these three parts vary in size and configuration. Motion sensors, for example, can be used to activate floodlights, sound audible alarms, activate switches, and even alert the police. Figure1: Motion SensorⅣ Types of Motion SensorsActive Ultrasonic SensorsActive sensors have a transmitter as well as a receiver. This sensor detects motion by measuring changes in the amount of sound or radiation that is reflected back into the receiver. Passive infrared (PIR)A passive infrared sensor detects body heat (infrared energy) by monitoring temperature changes. This is the most common type of motion sensor found in home security systems. Figure2:Passive infrared (PIR) Microwave (MW)This type of sensor emits microwave pulses and detects reflections from moving objects. 1 They have a larger coverage area than infrared sensors, but they are more expensive and susceptible to electrical interference. Figure3:Microwave (MW) Dual technology motion sensorsThis type of sensor emits microwave pulses and detects reflections from moving objects. 1 They have a larger coverage area than infrared sensors, but they are more expensive and susceptible to electrical interference. Figure4: Dual technology motion sensorsEach sensor type operates in a different part of the electromagnetic spectrum (ranging from passive to active). Dual technology motion sensors are less likely to cause false alarms than other types because both sensors must trip to sound an alarm. This is not to say that they never cause false alarms. Less common types of motion detectorsTomographic motion sensors are composed of several nodes. The nodes connect to form a mesh network. When the link between two nodes is broken, these sensors detect the presence of a person or object.Vibration motion sensors detect people and objects by detecting small vibrations caused by movements such as footsteps. Ⅴ How do Active Ultrasonic Sensors and Passive Infrared (PIR) Work?The two most common motion sensor technologies are active ultrasonic sensors and passive infrared sensors, both of which are well-known for their accuracy and dependability.5.1 Active Ultrasonic SensorsActive ultrasonic sensors produce ultrasonic sound waves that are higher in frequency than the human hearing range. These waves are bouncing off nearby objects and returning to the motion sensor. A transducer within the sensor serves as a signal waypoint, sending the pulse and receiving the echo. The sensor calculates the distance between itself and the target by measuring the time between signal transmission and reception. Most motion sensors allow you to adjust the sensitivity, which means it won't trigger if the distance between the sensor and the object is too great. If the received signal falls within the specified parameters, the motion sensor will activate, alerting you that someone or something is close to the sensor.Motion sensors installed at entry points such as windows and doors can be programmed to sound a burglar alarm. Door and window sensors are specifically designed to detect an intruder, so you should not experience false alarms or excessive notifications.Ultrasonic sensors are capable of detecting objects regardless of color, surface type, or material type (i.e., metallic vs. non-metallic). They can detect translucent objects as well, though this is typically reserved for industrial applications.Figure5:Active ultrasonic sensors 5.2 PIR SensorsPIR sensors are more complicated than active ultrasonic sensors, but the results are the same.Walls, floors, stairwells, windows, cars, dogs, trees, people—you name it—emit heat. Temperature can be detected using infrared waves. Infrared motion sensors detect the presence of a person or object by measuring the temperature change in a specific area. 5.3 Example of PIR SensorsTo demonstrate how this works, we'll use a motion detection camera, though any PIR motion sensor will do.A PIR camera contains two sensors. When no one is present, the PIR camera detects ambient IR emitted by background objects such as walls and doors. When a person (or animal, object, etc.) moves in front of the camera, the first sensor detects their heat signature, causing the camera to activate, triggering your alarm, and sending you an alert. If the object moves out of the camera's field of view, the second sensor will activate, noting the sudden drop in temperature.These temperature changes are used by a PIR motion sensor to detect the presence of a person or object. PIR sensors, like active ultrasonic sensors, can be configured to ignore small changes in IR, allowing you to walk around your home or business without setting off alarms all day and night. Ⅵ How to Install a Motion Sensor?Typical motion sensors have a range of up to 80 feet, which means that a single sensor will most likely not cover a long hallway or an open workspace. You can have your security system installed by a security company such as Bay Alarm. Our installers will examine the layout of your space to determine the best location for motion sensors. Our goal, as with security cameras, fire alarms, and burglar alarm installations, is to make your home or business as secure as possible, with devices and components strategically placed.After the sensors have been installed, a security agent will integrate them with your burglar alarm system. Using one of two apps: SureHome by Bay Alarm or Bay Alarm Access, you'll have quick access to your entire security system from your phone.If you decide to do your own security, make sure to follow the instructions that come with the sensor. Here are some pointers for installing motion detectors in your home or business: Step1:Take your motion detector out of the box.Your motion sensor kit should include instructions as well as mounting hardware. If your device has separate batteries, insert them into your motion sensor now. Step2:TDecide on a locationCorners are ideal because they allow you to position infrared sensors to cover the most ground. Most motion sensor designs have angled edges with screw holes to fit neatly into a room's corner.Mount your motion detector high on the wall to get the best coverage—but avoid putting it over a large piece of furniture, like a bookshelf or entertainment center, because it will limit the passive infrared energy range.Mount your motion sensor opposite the main entrance—this applies in every room or hallway where you place these sensors so they can detect intruders right away. Step3:Mount the sensorBecause passive infrared sensors are lightweight, you won't need drywall anchors or studs. A standard screwdriver will suffice, but an electric screwdriver or drill will expedite the process.Most motion detectors include a mounting bracket that detaches from the main body of the device, allowing you to screw it into the wall first, then clip the motion sensor back in. This also makes removing the motion detector from the wall during maintenance easier. Other infrared sensors may necessitate a complete disassembly before mounting. Step3: Connect your sensor to your systemConnect your motion sensor to your system according to the manufacturer's instructions. Most DIY systems will walk you through this process, frequently using the main keypad or a mobile app to configure and adjust your motion detectors.TIPS: Z-Wave-enabled smart motion sensors connect to your phone for easy access and notifications. Whether you're just getting started with your smart home build or you already have dozens of connected devices, Z-Wave-enabled motion sensors are a worthwhile addition. Step4: Adjust your motion detection settingsWhen you arm your system, most motion detectors have three main settings:In instant mode, any movement sets off an alarm.In entry delay mode, the sensor operates on a delay; even if it detects motion, you have approximately 30–60 seconds to disarm the system before an alarm is triggered.Interior follow-up mode operates on an entry delay, but only when the door contact triggers first—it sounds an instant alarm if it detects motion in the home without the door contact triggering. Step6: Maintain your motion detectorDust and debris can accumulate on the screen of your motion sensor over time, interfering with the infrared energy and making it less effective at motion detection. Use a dry or slightly damp microfiber cloth to clean it at least once every couple of months.If you decide to paint a wall near your motion sensor, make sure to first remove the device. If paint gets on a passive infrared motion sensor, it must be replaced. Additional tips for installing motion sensorsTake into account the size of your pets.Overhangs reduce range.Do not obstruct the infrared.Not all motion sensing light switches are created equal. Ⅶ Other Uses for Motion SensorsMotion sensors are useful for more than just home security. Many industrial fields use them on assembly lines to count the number of products and to shut down dangerous equipment if someone gets too close.Here are a few other uses for motion sensorsTo automate the opening and closing of doorsTo activate and deactivate automatic water faucets and toiletsWhen a person enters a room, lights are turned on.ATM display controlAt ticket vending machinesFor certain parking meter Ⅷ FAQ1. Which motion sensor is best?Best Motion SensorsPhilips. Hue Smart Motion Sensor. A solid choice if you are looking for a motion sensor for indoor use that's also intuitive. ...First Alert. Motion Sensing Light Socket. ...SadoTech. Wireless PIR. ...Chamberlain. Wireless Motion Sensor. ...1byone. Safety Driveway Patrol.2. Are motion sensors effective?Motion sensors are proven to be effective at leading to apprehensions. ... Motion sensors can be more cost-effective for rooms with many windows that would require several sensors to protect. A motion detector can alert you immediately if there is movement is detected.3. What can set off a motion detector?What can set off a motion detector? Moveable objects such as balloons, curtains, decorations, and pets can set off motion detectors. How to prevent this: Consider positioning motion sensors above waist level so pets can move around freely, and away from curtains and other items that may move or drift.4. Do motion detectors work in the dark?The short answer is yes. Motion sensors do work in complete darkness, as none of the motion sensors mentioned above are reliant on using images to detect motion. Instead of images, PIR motion sensors detect changes in the level of received infrared. Likewise, ultrasonic motion sensors also do not require images.5. How long do motion sensors last?On average, a motion detector light will stay on for up to 20 minutes. That amount of time is extended each time a sensor detects fresh movement, so it is possible for a motion detector light to stay on for much longer than 20 minutes at a time.6. Does motion sensor have camera?Most smart security cameras are motion sensor cameras. This means that they have a smart sensor built-in – and that's the key to your smart camera always being ready to record when something happens.7. What is the difference between PIR and motion sensor?As the name implies, motion sensors detect moving objects outside or even inside your home. They are often tied to lights, alarms, security cameras, and most recently, smart doorbells. ... PIR or Passive Infrared motion sensors are designed to reliably detect people, large pets & other large warm moving objects.
kynix On 2021-12-06
Introduction Radio Frequency Identification (RFID) is a type of automatic identification technology that uses radio frequency to carry out wireless non-contact two-way data communication, with recording media (electronic tags or radio frequency cards) to read and write. The purpose is identifying the target and making data exchange. This is an extremely complex system, so it involves many parameters. Next, we will introduce several important parameters in detail. What is RFID? How RFID works? Catalog Introduction Ⅰ RFID Parameters Explained 1.1 Rx Sensitivity 1.2 SNR (Signal-to-Noise Ratio) 1.3 Tx Power 1.4 ACLR/ACPR 1.5 Modulation Spectrum/Switching Spectrum 1.6 SEM (Spectrum Emission Mask) 1.7 EVM (Error Vector Magnitude) 1.8 Interference Indicators 1.9 Dynamic Range, Temperature Compensation and Power Control Ⅱ FAQ Ⅰ RFID Parameters Explained Radio frequency identification involves many settings, that is, parameter selections. What are they? Here gives you the detailed descriptions as following mentioned. 1.1 Rx Sensitivity Receiving sensitivity is one of the most basic concepts, characterizes the lowest signal strength that the receiver can recognize without exceeding a certain bit error rate (BER), which is a general term that follows the definition of the circuit switched (CS) era. In most cases, BER or Packet Error Rate (PER) will be used to examine the sensitivity. In the Long Term Evolution (LTE) era, use throughput to define simply. LTE does not have a circuit-switched voice channel, but this is also a real evolution. Because for the first time we no longer use "standardization" such as 12.2kbps RMC (voice coding at 12.2kbps) to measure sensitivity, but the throughput that users can really feel. 1.2 SNR (Signal-to-Noise Ratio) When talking about sensitivity, we often refer to SNR (signal-to-noise ratio), we generally talk about the demodulation SNR of the receiver. We define it as the ability of the demodulator to not exceed a certain bit error rate, that is, SNR threshold for demodulation.So where do S and N come from? S means Signal, or useful signal; N means Noise. The useful signal is generally emitted by the communication system transmitter, and the source of noise is very wide. The most typical one is the famous -174dBm/Hz (natural noise). It is a quantity that has nothing to do with the type of communication system. In a sense, it is actually a noise power density related to temperature. In addition, how much bandwidth do we receive determine the noise, that is, the final noise power is integrated on the bandwidth by the noise power density. 1.3 Tx Power The importance of the transmission power is that the signal from the transmitter needs to pass through the fading of space to reach the receiver. So the higher the transmission power means the longer the communication distance.So should we consider SNR for our transmitted signal? For example, if the SNR of our transmitted signal is very poor, do we receive the same bad?This involves the concept just mentioned, the natural noise we assume that spatial fading has the same effect on both signal and noise (in fact, it is not, the signal can resist fading through coding but noise not) and it acts like an attenuator. For example, we assume spatial fading is -200dB, the transmitted signal bandwidth is 1Hz, the power is 50dBm, and the SNR is 50dB, then what is the SNR received by the receiver?The power of the signal received by the receiver is 50-200=-150Bm (bandwidth 1Hz), and the noise of the transmitter 50-50=0dBm through spatial fading, and the power reaching the receiver is 0-200=-200dBm (bandwidth 1Hz)? At this time, this part of the noise has already been "submerged" under the natural noise -174dBm/Hz. At this time, we only need to consider the "basic component" of -174dBm/Hz to calculate the noise to the receiver. Actually, this is applicable in most cases of communication systems. 1.4 ACLR/ACPR These parameters are explained together because they actually represent part of the "transmitter noise", but these noises are not in the transmitting channel, but the part that the transmitter leaks into the adjacent channels, which can be collectively referred to as "Leakage in the adjacent channel".ACLR and ACPR (actually one thing, but one is called in the terminal test, the other is called in the base station test), both are named after "Adjacent Channel". They both describe the machine pair interference from other equipment. And their power calculation of the interference signal is also based on a channel bandwidth. This measurement method considers the signal leaked by the transmitter and the interference to the equipment receiver of the same or similar standard-the interference signal falls into the receiver band with the same frequency and the same bandwidth. That is, form the same frequency interference to the signal received by the receiver.In LTE, the ACLR test has two settings: EUTRA and UTRA. The former describes the interference among the LTE systems, and the latter considers the interference of the LTE system to the UMTS system. So we can see that the measurement bandwidth of EUTRAACLR is the occupied bandwidth of LTE RB, and the measurement bandwidth of UTRA ACLR is the occupied bandwidth of UMTS signals (FDD system 3.84MHz, TDD system 1.28MHz). In other words, ACLR/ACPR describes a kind of "peer-to-peer" interference: the leakage of the transmitted signal interferes with the same or similar communication system.This definition is significant. For example, in the actual network, there are often signal leakage from neighboring cells from other or in the same region. In other words, the adjacent channel leakage of the system itself is typical for neighboring cells. Therefore, the process of network planning and optimization is actually the process of capacity maximization and interference minimization. In addition, from the other side of the system, the mobile phones of users in crowded people may also become a source of mutual interference.Similarly, in the evolution of communication systems, the goal has always been to "smooth transition", that is, to upgrade and transform existing networks into next-generation networks. Therefore, the coexistence of two or even three generations of systems should consider the interference between different systems. So the introduction of UTRA in LTE is to consider the radio frequency interference to the previous generation system UMTS. 1.5 Modulation Spectrum/Switching Spectrum In the GSM system, Modulation Spectrum and Switching Spectrum also play a similar role to adjacent channel leakage. The difference is that their measurement bandwidth is not the occupied bandwidth of the GSM signal. From a definition point of view, it can be considered that the modulation spectrum is a measure of the interference between synchronous systems, and the switching spectrum is a measure of the interference between asynchronous systems. In fact, if the signal is not gating, the switching spectrum will definitely cover the modulation spectrum.This involves another concept: in the GSM system, the cells are not synchronized, although it uses TDMA. In contrast, TD-SCDMA and later TD-LTE, the cells are synchronized.Because the cells are not synchronized, the power leakage of the rising edge/falling edge of the A cell may fall to the payload part of the B cell, so we use the handover spectrum to measure the interference of the transmitter to the adjacent channel in this state. And in the entire 577us GSM timeslot, the proportion of rising edge/falling edge is very small after all. What’s more, most of the time, the payload of two adjacent cells will overlap in time. In this case, the interference of the transmitter to the adjacent channel can be evaluated by referring to the modulation spectrum. Figure 1. RFID Chip 1.6 SEM (Spectrum Emission Mask) SEM is an in-band indicator, which is distinguished from spurious emission. The latter includes SEM, but the focus is on the spectrum leakage outside the working frequency band of the transmitter. In addition, its introduction is more based on the perspective of EMC (Electromagnetic Compatibility).SEM provides a spectrum template. When measuring the spectrum leakage in the transmitter band, see if there are any points that exceed the template limit. It can be said that it is related to ACLR, but it is not the same. ACLR considers the average power leaked into the adjacent channel, so it uses the channel bandwidth as the measurement bandwidth, and it reflects the "critical noise point" of the transmitter in the adjacent channel. Where SEM reflects the capture of over-standard points in adjacent frequency bands with a smaller measurement bandwidth (usually 100kHz to 1MHz), which reflects the noise-based spurious emission.If you scan the SEM with a spectrum analyzer, you can see that the spurious points on the adjacent channel will generally be larger than the ACLR average. Therefore, if the ACLR indicator itself has no margin, the SEM will easily exceed it. On the other hand, if the SEM exceeds the ACLR, it does not necessarily mean bad. For example, a common phenomenon is that there is LO spurious or a certain clock and LO modulation component (often very narrow bandwidth, similar to dot frequency) in the transmitter link, although ACLR is good, the SEM may exceed the standard. 1.7 EVM (Error Vector Magnitude) EVM is a vector, which means it has amplitude and angle. It measures the error between the actual signal and the ideal signal. This measurement can effectively express the "quality" of the transmitted signal. That is, the farther the point distance of the actual signal to the ideal signal, the greater the error and the greater the modulus of the EVM.Why is the SNR of the transmitted signal not so important? There are two reasons: the first is that it is often much higher than the SNR required for demodulation of the receiver. The second is the condition, that is, the worst case. The transmitter noise has already been submerged under the natural noise after a large spatial fading, and the useful signal is also attenuated to near the demodulation threshold of the receiver.But the "intrinsic SNR" of the transmitter needs to be considered in some cases, such as short-range wireless communication. Even without considering the spatial fading, demodulation of such high-order quadrature modulated signals alone already requires a high SNR. The worse the EVM, the worse the SNR and the higher the difficulty of demodulation. Engineers working on 802.11 systems often use EVM to measure Tx linearity. While engineers working on 3GPP systems, they like to use ACLR/ACPR/Spectrum to measure it.From the origin, 3GPP is the evolutionary path of cellular communication, and from the very beginning it has to pay attention to adjacent channel and alternative channel interference. In other words, interference is the number one obstacle that affects cellular communication rates. Therefore, 3GPP always aims at "minimizing interference" during its evolution, such as frequency hopping in the GSM era, spread spectrum in the UMTS era, and the RB concept in LTE era.The 802.11 system is an evolution of fixed wireless access. It follows the spirit of the TCP/IP protocol and aims at "service first". In 802.11, there use often time division or frequency hopping methods to achieve multi-user coexistence. The network layout is more flexible, and the channel width is also flexible and variable. In general, it is not sensitive to interference (or rather high tolerance).In layman's terms, the origin of cellular communication is to make phone calls, and users who cannot get through the phone will go to the telecommunications; while the origin of 802.11 is the local area network, you just wait at first when the network is not good.So this determines that the 3GPP series must take ACLR/ACPR and other "spectrum regeneration" performance as indicators, while the 802.11 series can adapt to the network environment at the expense of speed.Specifically, "Adapt to the network environment at the expense of speed" means that in the 802.11 series, different modulation orders are used to cope with the propagation conditions. When the receiver finds a signal difference, it immediately informs the opposite transmitter to reduce the modulation order. As mentioned earlier, SNR and EVM in an 802.11 system are highly correlated. To a large extent, a reduction in EVM can improve SNR. In this way, we have two ways to improve the receiving performance: one is to reduce the modulation order, thereby reducing the demodulation threshold; the other is to reduce the transmitter EVM, so that the signal SNR is improved.Because EVM is closely related to the demodulation effect of the receiver, EVM is used to measure the performance of the transmitter in the 802.11 system (similarly, in 3GPP, ACPR/ACLR is the index that mainly affects the network performance). In addition, the deterioration of EVM is mainly caused by non-linearity (for example, AM-AM distortion of PA), so EVM is usually used as a sign to measure the linear performance of the transmitter. Figure 2. RFID 1.7.1 Relations of EVM to ACPR / ACLR It is difficult to define the quantitative relationship between EVM and ACPR/ACLR. From the non-linearity of the amplifier, EVM and ACPR/ACLR should be positively correlated. That is, the AM-AM and AM-PM distortion of the amplifier will amplify the EVM, and also the ACPR/ACLR.However, EVM and ACPR/ACLR are not always positively correlated. For example, Clipping is commonly used in digital IF. It is to reduce the peak-to-average ratio (PAR) of the transmitted signal. The reduction of peak power can help reduce the ACPR/ACLR after passing through the PA. However, clipping will also damage the EVM. Because whether it is clipping (windowing) or using a filter, they all cause damage to the signal waveform, affecting the EVM. 1.7.2 Source Flow of PAR PAR (Peak-to-Average Ratio) is usually represented by a statistical function such as CCDF, and its curve represents the power (amplitude) value of the signal and its corresponding probability of occurrence. For example, if the average power of a certain signal is 10dBm, the statistical probability that it has a power exceeding 15dBm is 0.01%, and we can consider its PAR is 5dB.PAR is an important factor affecting transmitter spectrum regeneration (such as ACLP/ACPR/Modulation Spectrum) in modern communication systems. The peak power will push the amplifier into the nonlinear region and produce distortion. And the higher the peak power, the stronger the nonlinearity.In the GSM era, because of the constant envelope characteristic of GMSK modulation, PAR is 0. When designing GSM power amplifiers, we often push it to P1dB to get the maximum efficiency. After the introduction of EDGE, 8PSK modulation is no longer a constant envelope, so we tend to push the average output power of the amplifier to about 3dB below P1dB, because the PAR of the 8PSK signal is 3.21dB.In the UMTS era, whether WCDMA or CDMA, the PAR is much larger than that of EDGE. The reason is the correlation of the signals in the code division multiple access system. In other words, when the signals of multiple code channels are superimposed in the time domain, the same phase may occur, and the power will show a peak at this time.The PNR of LTE is derived from the burstiness of the RB. OFDM modulation is based on the principle of dividing multi-user/multi-service data into blocks in both the time domain and the frequency domain, so that high power may appear in a certain "time block". LTE uplink transmission uses SC-FDMA. First, DFT extends the time domain signal to the frequency domain, which is equivalent to "smoothing" the burstiness in the time domain, thereby reducing PAR. Figure 3. RFID Applications 1.8 Interference Indicators The "interference index" here refers to the sensitivity test under various applied interferences in addition to the static sensitivity of the receiver. In fact, it is very interesting to study the origin of these test items.Our common interference indicators include Blocking, Desense, Channel Selectivity, etc. 1.8.1 Blocking Blocking is actually a very old RF indicator, as early as the invention of radar. The principle is to pour a large signal into the receiver (usually the first LNA that suffers the most), making the amplifier enter the nonlinear region or even saturate. At this time, on the one hand, the amplifier gain suddenly becomes smaller, and on the other hand, extremely strong nonlinearity occurs, so the function of amplifying useful signals cannot work normally.Another possible Blocking is actually done through the receiver's AGC. Large signals enter the receiver link, and the receiver AGC will reduce the gain to ensure dynamic range, but the useful signal level entering the receiver is very low. At this time, the gain is insufficient, and the amplitude of the useful signal entering the demodulator is insufficient.Blocking indicators are divided into in-band and out-of-band, mainly because the RF front-end generally has a band filter, which has an inhibitory effect on out-of-band blocking. However, the blocking signal is generally point frequency without modulation. In fact, point-frequency signals without modulation at all are rare in practice. In engineering, it is approximately point-frequency to replace various narrow-band interference signals.For solving Blocking, the key is RF. In other words, it is to expand the dynamic range of receiver. For out-of-band blocking, the rejection of the filter is also very important. 1.8.2 AM Suppression AM Suppression is a unique indicator of the GSM system. From the description point of view, the interference signal is a TDMA signal similar to the GSM signal, synchronized with the useful signal and has delay.This scenario simulates the signal of the neighboring cell in the GSM system. From the point of view that the frequency offset of the interference signal is greater than 6MHz (GSM bandwidth is 200kHz), this is a very typical neighboring cell signal configuration. So we can think that AM suppression is a reflection of the receiver's interference tolerance to neighboring cells in the actual work of the GSM system.Adjacent (Alternative) Channel Suppression (Selectivity)Here we collectively refer to it as "adjacent channel suppression". In the cellular system, in addition to the same-frequency cells, we must also consider adjacent-frequency cells in our networking. The reason can be found in the transmitter index ACLR/ACPR/Modulation Spectrum that we discussed before. Because of the transmitter's spectrum regeneration, there will be strong signals falling into adjacent frequencies (generally, the farther the frequency offset, the lower the level, so the adjacent channel is generally the most affected), and this kind of spectrum regeneration is actually related to the transmitted signal. That is, receivers of the same standard are likely to mistake this part of the regenerated spectrum as a useful signal for demodulation.For example, if two neighboring cells A and B happen to be neighboring frequency cells (such networking methods are generally avoided, here is just a assumption), when a terminal registered in cell A swims to the campus junction of two, but the signal strength of the two cells has not reached the handover threshold, the terminal still maintains cell connection with A, and the ACPR of the B cell base station transmitter is higher. So the terminal’s receiving frequency band has a higher ACPR component of B cell, which overlaps with the useful signal of cell A in frequency. Because the terminal is far away from the base station of cell A at this time, the received signal is weak. At this time, when the ACPR component of cell B enters the terminal receiver, it causes co-channel interference to the original useful signal.If we pay attention to the definition of the frequency offset of the adjacent channel selectivity, we will find that there is a difference between Adjacent and Alternative, which corresponds to the first and second adjacent channels of ACLR/ACPR. It can be seen that the "transmitter spectrum leakage (regeneration)" in the communication protocol and the "receiver adjacent channel selectivity" are actually defined in pairs. 1.8.3 Co-Channel Suppression (Selectivity) Co-frequency interference generally refers to the interference pattern between two cells.According to the networking principles we described earlier, the distance between two cells with the same frequency should be as far as possible. In addition, even if they are farther away, there will be signals leaking to each other, but the difference is in intensity. For the terminal, the signals of the two campuses can be regarded as "correct and useful signals" (of course, there is a set of access specifications on the protocol layer to prevent such false access). Frequency strength of both depends on its co-frequency selectivity. 1.8.4 Summery Blocking is big signal interferes with small signal, but the AM Suppression is small signal interferes with large signal.Single-tone Desense is a unique indicator of the CDMA system. It has a feature: the single-tone is an in-band signal and is very close to the useful signal. In this way, it is possible to generate two kinds of signals falling into the receiving frequency domain: First is due to near-end phase noise of the LO, the baseband signal formed by the mixing of the LO and the useful signal, and the signal formed by the mixing of the LO phase noise and the interference signal. Both will fall within the range of the receiver baseband filter, the former is a useful signal and the latter is interference. Second is due to the nonlinearity in the receiver system. The useful signal (with a certain bandwidth, such as 1.2288MHz CDMA signal) may produce intermodulation with the interference signal on the nonlinear device, falling in the receiving frequency domain and becoming interference.The origin of single-tone desense is that the CDMA system uses the same frequency band as the original analog communication system AMPS, and the two networks coexisted for a long time. So the CDMA system must consider the AMPS system's interference to itself.The explanation of Blocking in theory: the large signal entering the receiver causes the amplifier to enter the nonlinear region, and the actual gain becomes smaller (for useful signals).But it is difficult to explain two scenarios:Scenario 1: The pre-stage LNA has a linear gain of 18dB. When a large signal is injected to make it reach P1dB, the gain is 17dB. If no other influence is introduced (the default LNA NF, etc. have not changed), then the noise figure of the entire system is actually very limited. It is nothing more than the fact that the denominator of the latter-stage NF becomes a little smaller when it is included in the total NF, which has little effect on the sensitivity of the entire system.Scenario 2: The IIP3 of the previous LNA is very high, so it is not affected. The second level gain block is affected (the interference signal makes it reach near P1dB). In this case, the impact of the entire system NF is even smaller.Here is a point of view: the influence of Blocking may be divided into two parts. One part is that the gain mentioned in the textbook is compressed, and the other part is actually that after the amplifier enters the nonlinear region, the useful signal is distorted in this region. This kind of distortion may include two parts, one part is the spectrum regeneration (harmonic component) of the useful signal caused by pure amplifier nonlinearity, and the other part is the Cross Modulation of the large signal modulating the small signal.From this we also put forward another idea: if we want to simplify the Blocking test (3GPP requires frequency sweeping, which is very time-consuming), we may be able to select certain frequency points, which have the greatest impact on useful signal distortion when the Blocking signal appears.From an intuitive point of view, these frequency points may have: f0/N and f0*N (f0 is the useful signal frequency, and N is a natural number). The former is because the N-th harmonic component generated by the large signal in the nonlinear region is just superimposed on the useful signal frequency f0 to form direct interference, and the latter is superimposed on the N-th harmonic of the useful signal f0 and affects the output signal f0.According to Pascal's law, the waveform of the time domain signal is actually the sum of the domain fundamental frequency signal and each harmonic. When the power of the Nth harmonic in the frequency domain changes, the corresponding in the domain is the envelope change of the time domain signal (have distortion). Figure 4. RFID Readers 1.9 Dynamic Range, Temperature Compensation and Power Control These three indicators will only be shown when certain extreme tests are performed, but they themselves represent the most significant part of RF design. 1.9.1 Dynamic Range of the Transmitter The dynamic range of the transmitter characterizes the maximum and minimum transmission power without damaging other transmission indicators. This concept is very broad. If you look at the main effects, you can understand that the linearity of the transmitter is not compromised at the maximum transmission power, and the SNR of output signal is maintained at the minimum transmission power.Under the maximum transmit power, the output is often close to the nonlinear region of active devices at all levels (especially the final amplifier), and the nonlinearity that often occurs is spectral leakage and regeneration (ACLR/ACPR/SEM), modulation error (PhaseError/EVM). The most susceptible at this time is basically the linearity of the transmitter.Under the minimum transmit power, the useful signal output by the transmitter is close to the natural noise of the transmitter, and may even be submerged in the transmitter noise. At this time, what needs to be guaranteed is the SNR of the output signal. In other words, the lower the transmitter noise at the minimum transmit power, the better. 1.9.2 Dynamic Range of the Receiver The dynamic range of the receiver is actually related to the two indicators we talked about before, the first is the reference sensitivity, and the second is the receiver IIP3 (interference indicator).The reference sensitivity actually characterizes the minimum signal strength that the receiver can recognize. We mainly talk about the maximum receiving level of the receiver.It refers to the maximum signal that the receiver can receive without distortion. This distortion may occur at any stage of the receiver, from the previous LNA to the receiver ADC. For the front-level LNA, the only thing we can do is to increase IIP3 as much as possible so that it can withstand higher input power. For the subsequent step-by-step devices, the receiver uses AGC (automatic gain control) to ensure that the useful signal falls on the device within the input dynamic range. Simply put, there is a negative feedback loop: detect the received signal strength (too low/too high)-adjust the amplifier gain (up/down)-the amplifier output signal to ensure that it falls within the input dynamic range of the next stage device.Here we talk about an exception: the front-end LNA of most mobile phone receivers has AGC function. If you study their datasheet carefully, you will find that the front-end LNA provides several variable gain sections, and each gain section has its corresponding noise factor. Generally speaking, the higher the gain, the lower the noise factor. This is a simplified design. The design goal of the receiver RF link is to keep the useful signal input to the receiver ADC within the dynamic range and keep the SNR higher than the demodulation threshold (the SNR is not critical, but "just enough"). Therefore, when the input signal is large, the front-stage LNA reduces gain, loss NF, and increases IIP3 at the same time. When the input signal is small, the front-stage LNA increases gain, reduces NF, and meanwhile reduces IIP3. Figure 5. RFID Discover 1.9.3 Temperature Compensation Generally speaking, we only have temperature compensation in the transmitter. Of course, the receiver performance is also affected by temperature. On the one hand, the receiver link gain decreases at high temperatures, and NF increases. On the other hand, at low temperatures, receiver link gain increases, and NF decreases. However, due to the small signal characteristics of the receiver, both gain and NF are within the range of system redundancy.It can also be subdivided into two parts: one part is the compensation for the power accuracy of the transmitted signal, and the other part is the compensation for the change in the transmitter gain with temperature.Transmitters of modern communication systems generally perform closed-loop power control (except for the slightly "old" GSM system and Bluetooth system). Therefore, the power accuracy of transmitters calibrated through production procedures actually depends on the accuracy of the power control loop. Generally speaking, the power control loop is a small signal loop, and the temperature stability is very high, so the demand for temperature compensation is not high, unless there are temperature-sensitive devices (such as amplifiers) on the power control loop.Temperature compensation for transmitter gain is more common, which has two common purposes:One is "visible", usually for systems without closed-loop power control (such as the aforementioned GSM and Bluetooth), this type of system usually does not require high output power accuracy, so the system can apply a temperature compensation curve (function) to keep the RF link gain within an interval. So that when the baseband IQ power is fixed and the temperature changes, the RF power output by the system can also be kept within a certain range.The other is "invisible", usually in a system with closed-loop power control. Although the RF output power of the antenna port is precisely controlled by the closed-loop power control, we need to keep the DAC output signal within a certain range (A common example is the need for digital predistortion (DPD) of the base station transmission system), then we need to control the gain of the entire RF link more accurately around a certain value.In the early stage of low accuracy and low cost accuracy requirements, temperature compensation attenuators are more common. Require higher accuracy requirements, the solution generally: temperature sensor + digital attenuator/amplifier + production calibration. 1.9.4 Power Control of the Receiver After talking about dynamic range and temperature compensation, let's talk about a related and very important index: power control.Transmitter power control is a necessary function in most communication systems. Commonly used in 3GPP, such as ILPC, OLPC, and CLPC. In addition, it must be tested in RF design.All transmitter power control purposes include two points: power consumption control and interference suppression.Let’s first talk about power consumption control: In mobile communications, in view of the changes in the distance between the two ends and the different levels of interference, for the transmitter, it is only necessary to maintain the signal strength enough for the receiver of the other party to demodulate accurately. If it is low, the communication quality is impaired, and if it is too high, the empty power consumption is meaningless. This is especially true for battery-powered terminals like mobile phones.Interference suppression is a more advanced requirement. In CDMA-type systems, because different users share the same carrier frequency (differentiated by orthogonal user codes), in the signal arriving at the receiver, user's signal is covered by the same frequency for other users. If the signal power of each user is high or low, the high-power user will drown out the low-power user’s signal. Therefore, the CDMA system adopts a power control method to control the power of different users reaching the receiver, and sends a power control command to each terminal to make the air interface power of each user the same. This kind of power control has two characteristics: the first is that the power control accuracy is very high (the interference tolerance is very low), and the second is that the power control cycle is very short (the channel may change quickly).In the LTE system, uplink power control also has the effect of interference suppression. Because LTE uplink is SC-FDMA, and multiple users also share carrier frequencies, which also interfere with each other, so the same air interface power.The GSM system also has power control. In GSM, we use power level to characterize the power control step length, each level is 1dB. It can be seen that GSM power control is relatively rough.Interference Limited SystemHere is a related concept: interference limited system. The CDMA system is a typical interference limited system. In theory, if each user code is completely orthogonal and can be completely distinguished by interleaving and de-interleaving, then the capacity of the CDMA system can be infinite. Because it can be used on limited frequency resources. The user code extended layer by layer distinguishes an infinite number of users. But in fact, since the user codes cannot be completely orthogonal, noise is inevitably introduced during multi-user signal demodulation. The more users there are, the higher the noise will be, until the noise exceeds the demodulation threshold. In other words, the capacity of the CDMA system is limited by interference (noise).The GSM system is not an interference limited system, but a time-domain and frequency-domain limited system. Its capacity is limited by frequency (a carrier frequency of 200kHz) and time domain resources (8 TDMAs can be shared on each carrier frequency user). Therefore, the power control requirements of the GSM system are not strict. 1.9.5 Transmitter Power Control and Transmitter RF Indicators Next, let's discuss the factors that may affect the transmitter power control in the RF design.For RF, if the power detection (feedback) loop design is correct, then we can do not much for the transmitter closed-loop power control (most of the work is done by the physical layer protocol algorithm), and the most important thing is the flatness in the transmitter band.Because the transmitter calibration can only be carried out on a limited number of frequency points, especially in the production test, the less frequency points the better. However, it is entirely possible for the transmitter to work on any carrier in the frequency band in practice. In a typical production calibration, we will calibrate the transmitter's frequency points to keep accuracy. So the closed-loop power control is correct at the calibrated frequency points. However, if the transmit power is not flat in the entire frequency band, some frequency points deviates greatly from the calibration frequency point. Therefore, the closed-loop power control with the calibration frequency point as a reference will have errors and even mistakes. Ⅱ FAQ 1. What is RFID and how it works?RFID tags transmit data about an item through radio waves to the antenna/reader combination. ... The energy activates the chip, which modulates the energy with the desired information, and then transmits a signal back toward the antenna/reader. 2. What is RFID used for?RFID tags are a type of tracking system that uses radio frequency to search, identify, track, and communicate with items and people. Essentially, RFID tags are smart labels that can store a range of information from serial numbers, to a short description, and even pages of data. 3. Is RFID harmful to human?Electromagnetic fields generated by RFID devices—touted as a patient-safety technique to keep track of supplies, medical tests and samples, and people—could cause medical equipment to malfunction, according to a recent study of medical devices in Amsterdam published in the June 25 Journal of the American Medical. 4. What is RFID example?For example, an RFID tag attached to an automobile during production can be used to track its progress through the assembly line, RFID-tagged pharmaceuticals can be tracked through warehouses, and implanting RFID microchips in livestock and pets enables positive identification of animals. 5. What are the components of RFID?Every RFID system consists of three components: a scanning antenna, a transceiver and a transponder. When the scanning antenna and transceiver are combined, they are referred to as an RFID reader or interrogator. 6. Who discovered RFID?Charles WaltonRFID was, however, officially invented in 1983 by Charles Walton when he filed the first patent with the word 'RFID'. NFC started making the headlines in 2002 and has since then continued to develop. 7. How is RFID made?The antenna can be made of etched copper, aluminum or conductive ink, while the chip and antenna are typically put on a substrate that is PET or paper. ... Usually, this inlay is inserted into a printable label to create an RFID transponder that can be affixed to a product. 8. Where did RFID come from?The First RFID PatentsMario W. Cardullo claims to have received the first U.S. patent for an active RFID tag with rewritable memory on January 23, 1973. That same year, Charles Walton, a California entrepreneur, received a patent for a passive transponder used to unlock a door without a key. 9. What is a RFID system?Radio Frequency Identification (RFID) refers to a wireless system comprised of two components: tags and readers. ... Passive RFID tags are powered by the reader and do not have a battery. Active RFID tags are powered by batteries. RFID tags can store a range of information from one serial number to several pages of data. 10. What are the three parameters that define an RFID system?Every RFID system consists of three components: a scanning antenna, a transceiver and a transponder. When the scanning antenna and transceiver are combined, they are referred to as an RFID reader or interrogator. 11. What are the basic criteria in RFID?Many large organizations and government agencies have mandated that their suppliers provide goods with RFID tags. These published mandates may specify tag type, frequency, amount of memory, read range, read rate and speed, and protocol. In addition, the mandates may specify how the goods should be tagged. 12. What is the maximum read range of RFID module?Maximum read distance of 1.5 meters (4 foot 11 inches) - usually under 1 meter (3 feet) and you can use a single or multi port reader plus custom antennas to extend the read range to longer tag read distances or a wider RFID read zone. 13. What is RFID in supply chain management?+RFID (Radio Frequency Identification) is a form of extremely low-power data communication between a RFID scanner and an RFID tag. ... The tags are placed on any number of items, ranging from individual parts to shipping labels. 14. How many bits does an RFID tag have?It depends on the vendor, the application and type of tag, but typically a tag carries no more than 2 kilobytes (KB) of data—enough to store some basic information about the item it is on. Simple “license plate” tags contain only a 96-bit or 128-bit serial number. 15. Does RFID reader store data?An RFID tag can store large amounts of data additionally to a unique identifier • Unique item identification is easier to implement with RFID than with barcodes. • Its ability to identify items individually rather than generically.
kynix On 2021-11-26
IntroductionWith the advancement of automobile technology, an increasing number of cars are equipped with car tire pressure monitoring systems, which provide us with a quick and real-time understanding of the car tire pressure, and we no longer have to worry about insufficient and excessive tire pressure before driving, and the car tire pressure monitoring system has brought great convenience to our car. Currently, most car tires are equipped with pressure sensors to detect pressure changes in order to ensure the safety of car driving. According to relevant statistics, tire pressure reaches a reasonable value, which can not only improve driving safety but also reduce fuel consumption. So, how does a car tire pressure sensor work? This article will introduce in detail.Video: Tire Pressure Sensors CatalogIntroductionⅠ Principles of Tire Pressure Sensors in AutomobilesⅡ Design Background of TPMSⅢ Tire Pressure Sensors in a Tire Pressure Monitoring SystemⅣ Details of Tire Pressure Sensors in Direct Tire Pressure Monitoring SystemⅤ SummaryⅥ Frequently Asked Questions about Tire Pressure Sensors Ⅰ Principles of Tire Pressure Sensors in Automobiles1.Strain Sensors in AutomobilesThe principle of a strain sensor is primarily based on the resistive strain effect,when the conductor undergoes mechanical deformation due to external action, a corresponding change in resistance value occurs. Calculate the required pressure by first calculating the magnitude of strain using the relationship between the change in resistance value and the change in output electrical signal. The strain gauge pressure sensor is primarily used to measure the dynamic or static pressure of a flowing medium, such as the inlet and outlet gas or liquid pressure of power pipeline equipment, engine pressure, internal combustion engine pipeline pressure, and so on.The most widely used strain gauge is the paste strain gauge (strain gauge). Its main disadvantages are small output signal, narrow linear range, and poor dynamic response (see resistance strain gauge, semiconductor strain gauge). However, due to the small size of strain gauge, many specifications of commercial strain gauge can be selected, and the form of elastic sensor can be flexibly designed to adapt to various applications, strain type pressure sensor made by strain gauge is still widely used. According to the different structure of elastic sensor, strain type pressure sensor can be roughly divided into strain tube type, diaphragm type, strain beam type and combined type.Figure:Strain Sensors in Automobiles 2.Piezoresistive Pressure Sensors in AutomobilesThe piezoresistive pressure sensor's pressure sensitive element is a piezoresistive element that operates on the piezoresistive effect. The term "piezoresistive element" actually refers to the diffusion resistance created by integrated circuit technology on a semiconductor substrate. When subjected to external force, its resistance changes due to resistivity change. During normal operation, diffusion resistors must be attached to elastic elements, and monocrystalline silicon diaphragms are commonly used.The piezoresistive pressure sensor's main advantages are its small size, relatively simple structure, good dynamic response, high sensitivity, and ability to measure micro pressures of more than ten Pascals. It is a relatively ideal one, and it is currently being developed and applied at a rapid pace. Sensor of pressure. Non-linearity and temperature affect the measurement accuracy of this sensor, affecting the size of the piezoresistive coefficient. Microprocessors are used in today's intelligent piezoresistive pressure sensor to compensate for nonlinearity and temperature. It integrates the sensor and computer on the same silicon chip using large-scale integrated circuit technology, and it has functions such as signal detection, processing, and memory. As a result, the sensor's stability and measurement accuracy are greatly improved.Figure:Piezoresistive Pressure Sensor 3.Other Automotive Pressure SensorsFurthermore, differential transformer type pressure sensors (LVDT) and surface elastic wave pressure sensors are available (SAW). SAW type pressure sensors have small size, light weight, low power consumption, high reliability, high sensitivity, high resolution, digital output, and so on. LVDT type pressure sensors have larger output, easy to digital output, but poor anti-interference. It is used to detect the pressure of an automobile suction valve and can operate reliably in high temperatures. Ⅱ Design Background of TPMSThe tire pressure influences both the car's excellent performance and the length of the tire's service life. According to SAE (Society of Automotive Engineers) data, there are more than 260,000 traffic accidents caused by tire failure in the United States each year, with flat tires accounting for 70% of highway accidents. Furthermore, natural tire leakage or under-inflation is the leading cause of tire failure. Every year, approximately 75% of tire failures occur. The data also shows that in high-speed driving, punctures caused by tire failure are a major cause of traffic accidents.Flat tires, the unseen killer, have caused numerous human tragedies and incalculable economic losses to the country and businesses. As a result, in order to reduce the number of traffic accidents caused by flat tires, the US federal government has mandated that automakers accelerate the development of TPMS ( Tire Pressure Monitoring System).Figure:Tire Pressure Monitoring System Ⅲ Tire Pressure Sensors in a Tire Pressure Monitoring SystemThere are two main tire pressure monitoring system solutions: direct system and indirect system.The direct tire pressure monitoring system measures tire pressure directly using the pressure sensor installed in each tire and displays and monitors the tire pressure. The system will automatically alert if the tire pressure is too low or if there is a leak.To monitor tire pressure, the indirect tire pressure monitoring system compares the speed difference between tires using the wheel speed sensor of the automobile abs system.The main disadvantages of this type of system are as follows: 1. The accurate instantaneous air pressure value of each tire cannot be displayed; 2. It is not possible to alarm when the pressure of the same axle, same side wheel, or all tires drops at the same time; and 3. Factors such as vehicle speed and detection accuracy cannot be taken into account simultaneously.Figure:Tire Pressure Sensors in a TPMS Ⅳ Details of Tire Pressure Sensors in Direct Tire Pressure Monitoring SystemThere are two types of direct tire pressure monitoring systems: active and passive.The active system makes capacitive or piezoresistive pressure sensors on silicon using mems technology. Each rim has a pressure sensor, and the signal is transmitted via radio frequency. It is set up in the wireless cab. The pressure sensitive signal is received by the receiving device, which then displays the current tire pressure after some signal processing.The advantage of active technology is that it is relatively mature, and the modules developed can be applied to tires of various brands, but the disadvantages are also more noticeable. Its induction module requires battery power, posing a problem with system service life.The passive tire pressure monitoring system's sensor is based on surface acoustic waves. A radio frequency electric field is used to generate a surface acoustic wave in this sensor. The surface acoustic wave changes as it passes through the surface of the piezoelectric substrate material. The change in the surface acoustic wave can indicate tire pressure. Although this technology does not require battery power, it does necessitate the integration of the transponder into the tire, and it can only be implemented if tire manufacturers agree on a common standard. The tire pressure monitoring system must detect abnormal tire pressure conditions, and it can only do so with high resolution and accuracy. Battery life is limited, and capacity is affected by temperature as well. It is best for the sensor to perform passive detection in order to improve system reliability. According to studies, the information collected by tire pressure sensors can be used to monitor vehicle suspension failures and correct navigation systems. As a result, the future automotive pressure sensor should be a passive intelligent sensor with multiple functions. Ⅴ SummaryIn recent years, automotive sensors have been the fastest growing and most widely used sensor category. The growth of the automotive industry encourages the rapid development of automotive pressure sensors. Sensor performance is improving as a result of advances in manufacturing and process technology, and tire pressure monitoring is becoming increasingly important. Ⅵ Frequently Asked Questions about Tire Pressure Sensors1.When should a tire pressure sensor be replaced?TPMS sensors are designed to last for many years.5-10 years is a likely lifespan. Given their cost, most drivers will be inclined to replace TPMS sensors on an “as needed” basis.In other words, only once their batteries have expired, or other TPMS components have failed. 2.Is it safe to drive with tire pressure sensor fault?No, driving with the TPMS Light on is not safe. It means one of your tires is underinflated or overinflated. This can cause undue wear on the tire, potentially lead to a tire failure, and cause a blowout dangerous to you and other drivers on the road. 3.How much does it cost to replace a tire pressure sensor?The average cost for TPMS sensor replacement is between $207 and $257. Labor costs are estimated between $53 and $67 while parts are priced between $154 and $190. This range does not include taxes and fees, and does not factor in your specific vehicle or unique location. Related repairs may also be needed. 4.How do you fix a tire pressure sensor?Without starting the car, turn the key to the “On” position. Press the TPMS reset button and hold it until the light blinks three times, then release it. Start the car and let it run for 20 minutes to reset the sensor. You'll usually find the tire pressure monitor reset button beneath the steering wheel. 5.How do I know if my tire pressure sensor is bad?A small light illuminates at the dashboard's display panel whenever there is a problem with the tire pressure sensors. It appears as a vivid yellow exclamation point inside of a U symbol; you'd be easily able to spot it. As soon as it turns on, the driver must check the tire for less or no air.
kynix On 2021-08-26
Join our mailing list!
Be the first to know about new products, special offers, and more.
Feature Posts
How Resistors Work: From Basic Principles to Advanced Applications2025-07-30
DC Switching Regulators: Principles, Selection, and Applications2025-05-30
FPGA vs CPLD: In-depth Analysis of Architecture, Performance and Application2025-05-07
MOSFET Technology: Essential Guide to Working Principles & Applications2025-05-04
SMD Resistor: Types, Applications, and Selection Guide2025-04-30