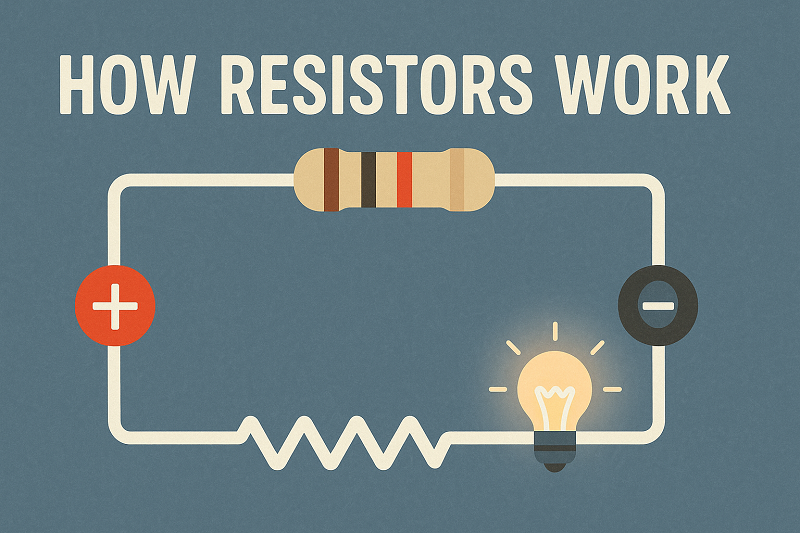
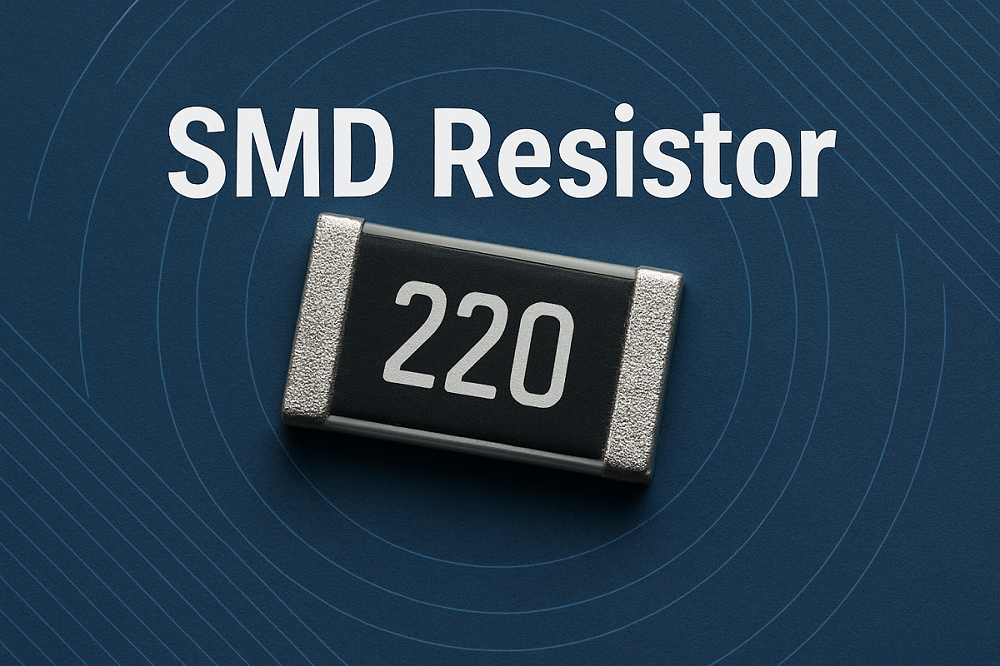
I Introduction: The Unsung Hero of ElectronicsHave you ever wondered what makes your electronic devices tick? From your smartphone to your smart home gadgets, countless components work in harmony to bring technology to life. Among these, one unassuming yet critical component often goes unnoticed: the resistor. It’s the unsung hero, quietly ensuring that everything functions as it should. In this comprehensive guide, we’ll dive deep into the world of resistors, exploring their fundamental principles and advanced applications. By the end, you’ll have a profound understanding of why these tiny components are so indispensable.A. What is a Resistor?At its core, a resistor is a passive electrical component that creates resistance in the flow of electric current. Think of it like a water flow regulator in a pipe system. Just as a valve controls the amount of water flowing through a pipe, a resistor controls the amount of electrical current flowing through a circuit. Without resistors, sensitive components could be overwhelmed by excessive current, leading to damage or malfunction. Their ability to limit current and divide voltage makes them fundamental to nearly all electronic circuits, from the simplest LED circuit to the most complex microprocessors. Understanding the basics of what a resistor is and how it functions is the first step in mastering electronics.B. Why Understanding Resistors is CrucialUnderstanding resistors isn’t just for electrical engineers; it’s crucial for anyone looking to delve into electronics, whether as a hobbyist or a professional. Resistors are essential for a multitude of reasons, including protecting components from overcurrent, controlling signal levels in audio circuits, and precisely dividing voltages in sensor applications. Imagine trying to power a delicate LED directly from a battery; without a resistor, the LED would likely burn out instantly due to excessive current. This article will guide you through everything from the basic theory of electrical resistance to practical applications, ensuring you gain a holistic understanding of these vital components. Get ready to unlock the power of resistance!II The Fundamental Function of a ResistorResistors are far more than just simple components; they are the silent workhorses that enable circuits to operate safely and efficiently. Their primary role is to manage the flow of electricity, ensuring that each part of an electronic system receives the precise amount of current and voltage it needs. Without this careful regulation, circuits would be prone to damage, and complex electronic devices simply wouldn’t function. Let’s explore the core functions and the underlying physics that make resistors so indispensable.A. What Does a Resistor Do in a Circuit?The most fundamental function of a resistor is to limit or regulate the flow of current. This is crucial for protecting sensitive components from being overloaded. For instance, an LED requires a specific amount of current to light up without burning out; a resistor ensures it gets just that. Beyond current limiting, resistors perform several other key functions:Voltage Division: Resistors can be arranged to create specific voltage levels within a circuit. This is incredibly useful for providing the correct operating voltage to different parts of a system from a single power source.Adjusting Signal Levels: In audio equipment or sensor interfaces, resistors are used to attenuate or control the strength of signals, ensuring they are at appropriate levels for processing.Heat Generation: While often an undesirable byproduct, in some specialized applications, resistors are intentionally used to convert electrical energy into heat, such as in heating elements or fuses.Protecting Components: Perhaps one of the most vital roles, resistors act as guardians, shielding delicate components like integrated circuits and transistors from excessive current that could otherwise destroy them. This protective function is a cornerstone of reliable circuit design.B. How a Resistor Achieves This: The Physics ExplainedThe working principle of a resistor is rooted in the concept of electrical resistance, which is the opposition to the flow of electrons. When electrons move through a material, they collide with atoms, converting some of their kinetic energy into heat. Materials used in resistors are specifically chosen for their ability to impede electron flow in a controlled manner. The amount of resistance depends on three main factors:Material: Some materials, like nichrome (an alloy of nickel and chromium), are inherently less conductive than others, making them excellent for creating resistance.Length: A longer conductive path means electrons encounter more atoms, leading to greater resistance. Imagine a long, narrow hallway compared to a short, wide one – it’s harder to move quickly through the longer, narrower space.Cross-sectional Area: A thinner conductive path offers more opposition to electron flow, increasing resistance. Think of water flowing through a narrow pipe versus a wide one; the narrow pipe restricts flow more significantly.By manipulating these physical properties, manufacturers can create resistors with precise resistance values. This process involves converting electrical energy into heat, a phenomenon described by Joule heating. This conversion is fundamental to how a resistor dissipates power, a concept we will explore further. Understanding this physical mechanism helps demystify how these small components exert such significant control over electrical currents.Various types of resistors, showcasing their diverse forms and applications.III Ohm’s Law: The Resistor’s Governing PrincipleIf resistors are the unsung heroes of electronics, then Ohm’s Law is their guiding scripture. This fundamental principle, discovered by German physicist Georg Simon Ohm, provides the mathematical relationship between voltage, current, and resistance in an electrical circuit. It’s the cornerstone of circuit analysis and design, allowing engineers and hobbyists alike to predict and control the behavior of electricity. Understanding Ohm’s Law is not just about memorizing a formula; it’s about grasping the very essence of how electricity flows and how resistors influence that flow.A. Defining Ohm’s LawOhm’s Law states that the voltage across a conductor is directly proportional to the current flowing through it, provided the temperature and physical conditions remain unchanged. In simpler terms, if you increase the voltage across a resistor, the current through it will increase proportionally, assuming the resistance stays constant. Conversely, if you increase the resistance, the current will decrease for a given voltage. This relationship is elegantly expressed by the core formula:Voltage (V) = Current (I) x Resistance (R)This formula, often remembered as V = I x R, is incredibly powerful because it allows you to calculate any one of these three quantities if you know the other two. It’s the bedrock upon which all circuit calculations are built, making it indispensable for anyone working with electronics. For a deeper dive into the history and implications of Ohm’s Law, you might find the Wikipedia article on Ohm’s Law to be an excellent resource.B. The Relationship Between Voltage, Current, and ResistanceTo truly appreciate Ohm’s Law, let’s break down each component:Voltage (V): Often referred to as electrical potential difference, voltage is the force that pushes the electric charge. It’s measured in Volts (V). Think of it as the pressure in our water pipe analogy; higher pressure means more force to push the water.Current (I): This is the rate of flow of electric charge, measured in Amperes (A). In our analogy, this would be the volume of water flowing through the pipe per unit of time.Resistance (R): As we’ve discussed, resistance is the opposition to the flow of current, measured in Ohms (Ω). This is analogous to the narrowness or roughness of the pipe, which restricts water flow.The beauty of Ohm’s Law lies in its direct and inverse relationships. For a given voltage, higher resistance leads to lower current. This is why resistors are used to limit current. Conversely, for a given resistance, higher voltage leads to higher current. This fundamental understanding is crucial for designing circuits that function correctly and safely. You can visualize this relationship using the Ohm’s Law triangle, a popular mnemonic aid: The Ohm’s Law triangle, a visual aid for remembering the formulas.C. Practical Application and Calculation ExamplesLet’s put Ohm’s Law into practice with some simple examples. These calculations are fundamental to understanding how resistors behave in real-world circuits.Example 1: Calculating CurrentSuppose you have a 12V battery connected to a 100Ω resistor. What is the current flowing through the resistor?Using Ohm’s Law: I = V / RI = 12V / 100Ω = 0.12 Amperes (A) or 120 milliamperes (mA)Example 2: Calculating ResistanceIf you want to limit the current through an LED to 20mA (0.02A) from a 5V power supply, and the LED has a forward voltage drop of 2V, what resistance do you need?First, calculate the voltage across the resistor: V_resistor = V_supply - V_LED = 5V - 2V = 3VNow, use Ohm’s Law: R = V / IR = 3V / 0.02A = 150 Ohms (Ω)Example 3: Calculating VoltageA circuit has a 0.5A current flowing through a 47Ω resistor. What is the voltage drop across the resistor?Using Ohm’s Law: V = I x RV = 0.5A x 47Ω = 23.5 Volts (V)These examples illustrate the versatility of Ohm’s Law in circuit design and troubleshooting. For more interactive learning, you can explore online Ohm’s Law calculators that allow you to input values and see the results instantly. Mastering these calculations is a crucial step in becoming proficient in electronics.Video: A clear explanation of Ohm’s Law with practical examples.IV Resistor Power Dissipation: Understanding the HeatWhile resistors are designed to limit current and divide voltage, an unavoidable consequence of their operation is the conversion of electrical energy into heat. This process is known as power dissipation, and it’s a critical factor to consider in circuit design. Ignoring power dissipation can lead to overheating, component failure, and even fire hazards. Understanding how to calculate and manage this heat is essential for building reliable and safe electronic circuits.A. What is Power Dissipation in a Resistor?Power dissipation in a resistor refers to the rate at which electrical energy is converted into thermal energy (heat). This occurs because as electrons flow through the resistive material, they collide with atoms, losing energy in the form of heat. It’s an inherent characteristic of resistance; any component that impedes current flow will dissipate power. While sometimes utilized, such as in heating elements, in most electronic applications, this heat is an undesirable byproduct that needs to be managed. The amount of heat generated is directly proportional to the current flowing through the resistor and the resistance value itself. This phenomenon is a direct consequence of Joule heating, where the energy lost by charge carriers is transformed into heat within the material.B. The Importance of Power RatingEvery resistor has a maximum power rating, typically specified in watts (W). This rating indicates the maximum amount of power the resistor can safely dissipate continuously without being damaged or significantly changing its resistance value. Exceeding this rating can lead to several problems:Overheating: The resistor can become excessively hot, potentially damaging itself or nearby components.Resistance Drift: High temperatures can permanently alter the resistor’s material properties, causing its resistance value to drift outside its specified tolerance.Complete Failure: In extreme cases, the resistor can burn out, open-circuit, or even catch fire, leading to circuit malfunction or safety risks.Choosing a resistor with an adequate power rating is paramount for circuit longevity and safety. It’s a common mistake for beginners to focus solely on the resistance value and overlook the power rating, which can lead to frustrating failures. Always consider the power dissipation requirements of your circuit.C. How to Calculate Power DissipationCalculating power dissipation is straightforward using variations of Ohm’s Law. The fundamental formula for power (P) is:P = V x I (Power = Voltage x Current)However, by substituting Ohm’s Law (V = I x R or I = V / R), we can derive two other useful formulas for calculating power dissipation in a resistor:P = I² x R (Power = Current squared x Resistance)P = V² / R (Power = Voltage squared / Resistance)Let’s look at a worked example:Worked Example: Power Dissipation CalculationSuppose you have a 10Ω resistor with 0.5A of current flowing through it. What is the power dissipated by the resistor?Using the formula P = I² x R:P = (0.5A)² x 10ΩP = 0.25 x 10P = 2.5 Watts (W)Important Note: It’s a good practice to select a resistor with a power rating that is at least double the calculated maximum power dissipation. This provides a crucial safety margin, ensuring the resistor operates well within its limits and prolongs its lifespan. For instance, if your calculation shows 2.5W, you should ideally choose a 5W resistor. This practice is often referred to asderating.Video: Explaining power dissipation in resistors.V A Comprehensive Guide to Resistor Types and ApplicationsJust as there are many different tasks in electronics, there are many different types of resistors, each designed for specific applications and performance characteristics. Understanding these variations is key to selecting the right component for your circuit. From the common resistors found in everyday gadgets to specialized ones used in high-precision equipment, let’s explore the diverse world of resistor types.A. Fixed Resistors: The Constant CompanionsFixed resistors are the most common type, providing a constant, unchanging resistance value. They are ubiquitous in almost every electronic circuit. Here are some of the most prevalent types:Carbon Composition Resistors: These are among the oldest types, made from a mixture of carbon powder and a phenolic resin. They are inexpensive and suitable for general-purpose applications where high precision isn’t critical. However, their resistance value can change with temperature and age.Carbon Film Resistors: Offering better tolerance and stability than carbon composition resistors, carbon film resistors are made by depositing a thin carbon film onto a ceramic substrate. They are widely used due to their good performance and relatively low cost.Metal Film Resistors: Known for their high precision, stability, and low noise, metal film resistors are created by depositing a thin metal film (like nickel-chromium) onto a ceramic rod. They are ideal for precision circuits, audio equipment, and measurement instruments where accurate resistance values are crucial. You’ll often find them with 1% or even 0.1% tolerance.Wire-Wound Resistors: These are made by winding a metal wire (usually nichrome) around a non-conductive core. Wire-wound resistors are primarily used for high-power applications (e.g., power supplies, motor controls) and precision applications where high accuracy and stability are required. They can dissipate significant amounts of heat due to their robust construction.Surface Mount (SMD) Resistors: These tiny, rectangular resistors are designed for direct mounting onto Printed Circuit Boards (PCBs). They are the workhorses of modern electronics, enabling miniaturization and automated assembly. You’ll find them in almost every contemporary electronic device, from smartphones to laptops. Their small size and excellent high-frequency performance make them indispensable in today’s compact designs. For more information on SMD components, you can refer to this article on SMD technology.B. Variable Resistors: Adjustable ResistanceUnlike fixed resistors, variable resistors allow their resistance value to be changed, either manually or by external factors. This makes them incredibly versatile for applications requiring adjustment or sensing.Potentiometers: These are three-terminal resistors with a sliding or rotating contact that forms an adjustable voltage divider. They are commonly used as volume controls in audio equipment, dimmers for lights, and position sensors. When you turn a knob on your stereo to adjust the volume, you’re likely interacting with a potentiometer.Rheostats: Similar to potentiometers but typically used as two-terminal devices to adjust current in a circuit. They are often found in high-power applications, such as controlling the speed of motors or the brightness of incandescent lights.Trimmers (Trimpots): These are miniature potentiometers designed for fine-tuning circuits during manufacturing or calibration. They are usually set once and then left untouched, unlike potentiometers which are meant for frequent user adjustment.C. Non-Linear Resistors: The Smart ResistorsNon-linear resistors are special types whose resistance changes significantly with environmental factors like temperature, light, or voltage. This property makes them ideal for sensing and protection applications.Thermistors: Their resistance changes predictably with temperature. There are two main types: NTC (Negative Temperature Coefficient), where resistance decreases as temperature increases, and PTC (Positive Temperature Coefficient), where resistance increases with temperature. Thermistors are widely used in temperature sensing (e.g., digital thermometers, automotive sensors) and temperature compensation circuits.Photoresistors (LDRs - Light Dependent Resistors): The resistance of an LDR decreases as the intensity of light falling on it increases. They are commonly used in light-sensing circuits, such as automatic street lights, camera light meters, and simple alarm systems. Their simplicity and low cost make them popular for basic light detection.Varistors (VDRs - Voltage Dependent Resistors): The resistance of a varistor changes with the applied voltage. Specifically, their resistance is very high at low voltages but drops sharply when the voltage exceeds a certain threshold. This characteristic makes them excellent for surge protection, diverting excessive voltage spikes away from sensitive electronic components. You’ll find them protecting power supplies and communication lines.Each type of resistor plays a unique role in the vast landscape of electronics, enabling everything from simple circuits to complex, intelligent systems. Choosing the right type depends heavily on the specific requirements of your application, including precision, power handling, cost, and environmental conditions. For a visual overview of various resistor types, consider checking out this helpful guide on different resistor types.VI Practical Skills: Reading, Testing, and Using ResistorsNow that you understand the theory behind resistors and their various types, it’s time to get practical. Being able to identify, test, and correctly connect resistors is fundamental to any electronics project. These skills will empower you to confidently work with circuits and troubleshoot issues. Let’s dive into the hands-on aspects of working with these essential components.A. How to Read Resistor Color CodesMost through-hole resistors use a system of colored bands to indicate their resistance value, tolerance, and sometimes their temperature coefficient. This resistor color code is an international standard, making it easy to identify resistor values at a glance. It might seem daunting at first, but with a little practice and a simple mnemonic, you’ll master it quickly.Here’s a step-by-step guide for decoding the color bands:Identify the first significant digit: The first band (closest to one end) represents the first digit of the resistance value.Identify the second significant digit: The second band represents the second digit.Identify the third significant digit (for 5-band resistors) or multiplier: For 4-band resistors, the third band is the multiplier. For 5-band resistors, the third band is the third significant digit, and the fourth band is the multiplier.Identify the multiplier: This band indicates how many zeros to add after the significant digits, or by what power of ten to multiply the significant digits.Identify the tolerance: The last band (often gold or silver, and usually spaced further apart) indicates the percentage deviation from the stated resistance value. Common tolerances are ±5% (gold) and ±10% (silver).Identify the temperature coefficient (for 6-band resistors): The sixth band, if present, indicates the temperature coefficient of resistance (TCR), which describes how much the resistance changes per degree Celsius.Mnemonic to remember the color sequence: “BB ROY of Great Britain had a Very Good Wife” (Black, Brown, Red, Orange, Yellow, Green, Blue, Violet, Grey, White). A standard resistor color code chart for quick reference.Pro Tip: If you’re ever unsure, or dealing with complex 5 or 6-band resistors, there are many excellent online resistor color code calculators that can instantly decode the value for you. Just input the colors, and it will tell you the resistance and tolerance.B. How to Test if a Resistor is WorkingEven with color codes, sometimes you need to verify a resistor’s value or check if it’s still functional. This is where a Digital Multimeter (DMM) comes in handy. Testing a resistor is a simple process:Visual Inspection: Before anything else, visually inspect the resistor for any signs of damage, such as charring, blackening, cracks, or swollen areas. These are clear indicators of failure.Turn off Power and Isolate: Crucially, always ensure the circuit is powered off and the resistor is isolated from the circuit (ideally, desolder one lead) before testing. Testing a resistor in-circuit can lead to inaccurate readings due to parallel paths.Set the DMM: Turn your DMM’s dial to the resistance (Ω) range. Start with a higher range if you don’t know the approximate value, and then adjust downwards for a more precise reading.Connect the Probes: Touch the red and black probes of the DMM to the two leads of the resistor. The polarity doesn’t matter for a resistor.Read the Value: The DMM display will show the resistance value. Compare this measured value to the resistor’s rated value (from its color code or datasheet), keeping its tolerance in mind. A reading within the tolerance range indicates a healthy resistor. If the reading is significantly off, or if it shows an “OL” (Over Limit) or “1” (Open Loop), the resistor is likely faulty.C. Resistors in Series and ParallelResistors are rarely used in isolation; they are often combined in series or parallel configurations to achieve a desired total resistance or to distribute power. Understanding how to calculate the equivalent resistance in these configurations is fundamental to circuit design.Series CircuitsWhen resistors are connected in series, they are placed end-to-end, forming a single path for the current to flow. The total resistance in a series circuit is simply the sum of the individual resistances. This means that adding more resistors in series will always increase the total resistance.Formula for Series Resistors:R_total = R1 + R2 + R3 + … + RnPractical Example: If you have three resistors with values of 10Ω, 20Ω, and 30Ω connected in series, the total resistance would be 10 + 20 + 30 = 60Ω. This configuration is often used to limit current more effectively or to drop a specific amount of voltage across different parts of a circuit.Parallel CircuitsWhen resistors are connected in parallel, both ends of the resistors are connected to common points, providing multiple paths for the current to flow. This configuration effectively decreases the total resistance, as current has more ways to bypass individual resistors. Adding more resistors in parallel will always decrease the total resistance.Formula for Parallel Resistors:1/R_total = 1/R1 + 1/R2 + 1/R3 + … + 1/RnFor two resistors in parallel, a simplified formula can be used:R_total = (R1 * R2) / (R1 + R2)Practical Example: If you have two resistors with values of 10Ω and 20Ω connected in parallel, the total resistance would be:1/R_total = 1/10 + 1/20 = 2/20 + 1/20 = 3/20R_total = 20/3 = 6.67Ω (approximately)Parallel configurations are commonly used to provide multiple current paths, to reduce the overall resistance, or to increase the power handling capability of a resistive network. For a more detailed explanation and visual examples of series and parallel circuits, you can refer to this comprehensive guide on series and parallel circuits.VII Advanced Concepts for the Enthusiast and ProfessionalAs you delve deeper into electronics, you’ll encounter more nuanced aspects of resistor behavior that are crucial for designing high-performance and reliable circuits. These advanced concepts move beyond the basics of Ohm’s Law and power dissipation, focusing on the subtle characteristics that can significantly impact circuit performance, especially in sensitive applications. Let’s explore some of these critical considerations.A. Resistor Tolerance and Temperature Coefficient (TCR)When you buy a resistor, its stated value (e.g., 100Ω) is an ideal. In reality, every resistor has a slight deviation from this ideal, known as its tolerance. Tolerance is the permissible variation from the specified resistance value, expressed as a percentage. Common tolerances include ±5%, ±1%, and for precision applications, even ±0.1% or lower. A 100Ω resistor with a ±5% tolerance means its actual resistance can be anywhere between 95Ω and 105Ω. For many general-purpose circuits, a 5% or 10% tolerance is perfectly acceptable. However, in applications like precision measurement equipment, medical devices, or high-fidelity audio, even a small deviation can lead to significant errors, making low-tolerance resistors essential.Another critical factor is the Temperature Coefficient of Resistance (TCR). This parameter describes how much the resistance value changes with temperature, measured in parts per million per degree Celsius (ppm/°C). For example, a TCR of 100 ppm/°C means that for every 1°C change in temperature, the resistance will change by 0.01%. While this might seem small, over a wide temperature range or in highly sensitive circuits, these changes can accumulate and cause performance issues. For instance, a metal film resistor typically has a much lower TCR than a carbon composition resistor, making it more stable across varying temperatures. Understanding TCR is vital for designing circuits that perform consistently in different thermal environments, ensuring stability and accuracy.B. Resistors in Voltage Divider CircuitsOne of the most common and powerful applications of resistors is in voltage divider circuits. A voltage divider is a simple series circuit that produces a fixed fraction of its input voltage. It’s essentially two resistors connected in series across a voltage source, with the output voltage taken across one of the resistors. This configuration allows you to step down a higher voltage to a lower, usable voltage for other components.The voltage divider formula is straightforward:Vout = Vin * (R2 / (R1 + R2))Where: * Vout is the output voltage across R2 * Vin is the input voltage across both resistors * R1 is the resistor connected to the positive supply * R2 is the resistor connected to ground (or the lower potential)Common applications of voltage dividers include providing a reference voltage to a sensor, biasing transistors, or creating specific voltage levels for integrated circuits. For example, if you have a 9V battery and need 3V for a small sensor, you can use a voltage divider. If R1 is 6kΩ and R2 is 3kΩ, then Vout = 9V * (3kΩ / (6kΩ + 3kΩ)) = 9V * (3kΩ / 9kΩ) = 9V * (1/3) = 3V. It’s important to note that voltage dividers are generally not suitable for powering loads that draw significant current, as this will affect the output voltage. For such cases, a voltage regulator is a more appropriate solution. You can learn more about voltage dividers and their applications on Electronics Tutorials.C. Resistor Failure Modes and AnalysisEven the most robust resistors can fail, and understanding their common failure modes is crucial for troubleshooting and improving circuit reliability. While resistors are generally very reliable, various factors can lead to their demise. Recognizing these failure patterns can help you diagnose issues and design more resilient systems.Common Failure Modes:Open Circuit: This is perhaps the most common failure mode, where the resistive element breaks, leading to an infinite resistance. The current path is completely interrupted. This can be caused by excessive heat (burning out the element), mechanical stress, or internal manufacturing defects. When a resistor goes open, the circuit it’s part of will often stop functioning entirely.Resistance Drift: The resistance value changes beyond its specified tolerance. This is a more subtle failure, often caused by aging, prolonged exposure to high temperatures, or chemical degradation (e.g., sulfur contamination in some types of resistors). A drifted resistor might cause a circuit to operate incorrectly or inefficiently, even if it hasn’t completely failed.Lead Breakage: Physical damage to the resistor leads, often due to excessive bending, vibration, or poor soldering, can cause an intermittent or complete open circuit. This is more of a mechanical failure than an electrical one.Short Circuit: This is a very rare failure mode for resistors. It implies the resistive element has somehow become a perfect conductor, offering zero resistance. This usually happens only under extreme conditions, such as a direct short across the resistor due to external factors, rather than an internal failure of the resistor itself.Causes of Failure:Overheating: The most frequent culprit. Exceeding the resistor’s power rating causes it to overheat, leading to thermal runaway and eventual burnout. This is why proper power dissipation calculation and derating are so important.Corrosion: Environmental factors, particularly humidity and chemical contaminants (like sulfur in the atmosphere), can corrode the resistive element or its connections, leading to resistance drift or open circuits.Mechanical Stress: Physical impacts, excessive vibration, or improper handling during assembly can cause internal damage or lead breakage.Electrostatic Discharge (ESD): While less common for robust power resistors, sensitive film resistors can be damaged by high voltage ESD events, leading to subtle changes in resistance or complete failure.Understanding these failure modes allows engineers to select appropriate resistor types for specific environments and to implement protective measures, enhancing the overall reliability and longevity of electronic systems. For more in-depth analysis of component failures, you might find resources from reputable engineering sites like EE Times useful.VIII How to Choose the Right Resistor: A Selection GuideSelecting the appropriate resistor for your circuit is a critical step in ensuring its proper function, reliability, and longevity. It’s not just about picking a value; it involves considering several factors that can significantly impact performance. This guide will walk you through the essential steps to make an informed decision, helping you avoid common pitfalls and optimize your designs.A. Step 1: Determine the Required Resistance ValueThe first and most obvious step is to determine the precise resistance value your circuit requires. This is typically derived from your circuit calculations, primarily using Ohm’s Law (V=IR). For instance, if you need to limit current to an LED or set up a voltage divider, your calculations will yield a specific resistance. Always double-check your math to ensure accuracy. Remember that standard resistor values (E-series) are available, so you might need to choose the closest standard value if your calculated value isn’t exact. Sometimes, a combination of series or parallel resistors can be used to achieve a non-standard value.B. Step 2: Calculate the Necessary Power RatingOnce you have the resistance value, the next crucial step is to calculate the maximum power dissipation the resistor will experience in your circuit. As discussed in Section IV, this is calculated using formulas like P = I²R or P = V²/R. After calculating the maximum expected power, always select a resistor with a power rating significantly higher than this calculated value. A common rule of thumb is to choose a resistor with a power rating at least double the calculated maximum. This derating practice provides a safety margin, preventing overheating and extending the resistor’s lifespan. For example, if your circuit dissipates 0.2W, a 0.5W or 1W resistor would be a safer choice than a 0.25W one.C. Step 3: Select the Appropriate ToleranceResistor tolerance dictates how close the actual resistance value is to its nominal value. The choice of tolerance depends entirely on the application’s precision requirements:General-purpose circuits (e.g., LED current limiting, simple pull-up/pull-down resistors) can often use 5% or 10% tolerance resistors. These are typically less expensive and widely available.Precision applications (e.g., analog signal processing, measurement equipment, sensitive sensor interfaces) will require 1% or lower tolerance resistors (e.g., 0.5%, 0.1%). While more costly, they ensure the circuit operates within tighter specifications. Always consider the impact of resistance variation on your circuit’s overall performance.D. Step 4: Consider the Resistor Type and MaterialThe type of resistor you choose will depend on the specific demands of your application beyond just resistance and power. Refer back to Section V for a detailed overview. Here are some considerations:Cost and Availability: Carbon film and metal film resistors are generally cost-effective and widely available for most common applications.High Power: For applications requiring significant power dissipation (e.g., power supplies, motor control), wire-wound resistors are often the best choice due to their robust construction and ability to handle high wattage.High Frequency: In high-frequency circuits (e.g., RF applications), metal film or SMD resistors are preferred due to their lower parasitic inductance and capacitance compared to wire-wound types.Space Constraints: For compact designs, Surface Mount Device (SMD) resistors are indispensable due to their small footprint.Adjustability/Sensing: If you need to adjust resistance (e.g., volume control) or sense environmental changes (e.g., temperature, light), then variable resistors (potentiometers, thermistors, photoresistors) are necessary.E. Step 5: Evaluate Environmental and Thermal PerformanceFinally, consider the operating environment of your circuit. Factors like temperature, humidity, and potential exposure to corrosive elements can affect a resistor’s long-term stability and reliability. Pay attention to the Temperature Coefficient of Resistance (TCR), especially for precision applications that will operate over a wide temperature range. Resistors with lower TCR values will maintain their resistance more consistently despite temperature fluctuations. Also, consider the physical size and mounting options, especially for high-power resistors that might require heat sinks or specific ventilation to manage their heat dissipation effectively. This holistic approach ensures that your chosen resistor not only meets the electrical requirements but also performs reliably under real-world conditions.Common Pitfalls When Buying ResistorsEven experienced engineers can sometimes fall into traps when selecting resistors. Here are some common pitfalls to avoid:Ignoring Power Rating: This is the most frequent and dangerous mistake. Underestimating the power dissipation can lead to resistor burnout, circuit failure, and even fire. Always calculate and derate!Overlooking Tolerance: Using a 5% tolerance resistor in a circuit that requires 0.1% precision will lead to inaccurate or unstable performance. Match the tolerance to the application’s needs.Assuming All Resistors Are Equal: Different resistor types have different characteristics (e.g., noise, frequency response, stability). A carbon composition resistor might be fine for a simple LED, but disastrous in a sensitive audio amplifier.Not Considering Temperature: Resistance values can drift with temperature. If your circuit operates in varying thermal environments, a resistor with a poor TCR can lead to performance issues.Buying Counterfeit Components: Especially when sourcing from non-reputable suppliers, counterfeit resistors with incorrect values or poor quality are a risk. Always buy from trusted distributors.Ignoring Physical Size: While often an afterthought, the physical size of the resistor needs to fit within your PCB layout and enclosure. High-power resistors are physically larger.Product Selection Checklist: How to Choose the Best Resistor for Your ProjectTo simplify your resistor selection process, use this checklist:Resistance Value (Ω): What is the calculated or required resistance? (e.g., 220Ω, 10kΩ)Power Rating (W): What is the maximum power dissipated? (e.g., 0.25W, 1W, 5W) Remember to derate!Tolerance (%): How precise does the resistance need to be? (e.g., ±5%, ±1%, ±0.1%)Type of Resistor: What are the specific application needs? (e.g., Metal Film for precision, Wire-Wound for high power, SMD for compact, Thermistor for temperature sensing)Temperature Coefficient (ppm/°C): Is temperature stability critical? (e.g., low TCR for precision)Physical Size/Package: Does it fit your PCB layout? (e.g., 0805 SMD, through-hole)Cost & Availability: Does it fit your budget and supply chain? (e.g., common values are cheaper)Environmental Factors: Will it be exposed to extreme temperatures, humidity, or chemicals?By systematically going through these steps, you can confidently select the right resistor for any electronic project, ensuring optimal performance and reliability. Remember, the right resistor is not just about the correct resistance value, but also about its ability to withstand the operational conditions and meet the circuit’s overall demands. Your thoughtful selection will be rewarded with a robust and well-functioning electronic design. I genuinely believe that taking the time to consider these factors will save you headaches down the line, and you’ll feel a real sense of accomplishment when your circuit performs exactly as intended!IX Conclusion: The Power of ResistanceWe’ve journeyed through the fascinating world of resistors, from their fundamental role as current regulators to their diverse types and advanced applications. It’s clear that these seemingly simple components are, in fact, the unsung heroes of electronics, quietly enabling the complex functionalities of nearly every device we interact with daily. You’ve learned about the critical importance of Ohm’s Law as the governing principle, how to calculate and manage power dissipation to ensure circuit longevity, and the vast array of resistor types available for every conceivable application.We’ve also covered essential practical skills, such as decoding resistor color codes and testing their functionality with a multimeter, along with understanding how they behave in series and parallel circuits. For the more enthusiastic, we delved into advanced concepts like tolerance, temperature coefficient, and common failure modes, all of which are vital for designing robust and reliable electronic systems. Finally, we equipped you with a comprehensive selection guide, ensuring you can confidently choose the right resistor for any project, avoiding common pitfalls.I truly hope this guide has demystified the resistor for you and ignited a deeper appreciation for its indispensable role. The power of resistance, both literally and figuratively, is immense in the world of electronics. Now, armed with this knowledge, I encourage you to apply what you’ve learned in your own electronics projects. Experiment, build, and explore! The more you work with these components, the more intuitive their behavior will become. Remember, every great electronic innovation stands on the shoulders of fundamental components like the resistor. Keep learning, keep building, and let your creativity flow!Fixed Resistor Types ComparisonTo help you quickly compare the characteristics of common fixed resistor types, here’s a summary table: Resistor TypeKey CharacteristicsTypical TolerancePower HandlingCostCarbon CompositionInexpensive, general-purpose, less stable±5% to ±20%Low to MediumLowCarbon FilmGood general-purpose, better stability than carbon comp±1% to ±5%Low to MediumLowMetal FilmHigh precision, high stability, low noise±0.1% to ±1%Low to MediumMediumWire-WoundHigh power, high precision, low noise±0.1% to ±5%Medium to HighMedium to HighSurface Mount (SMD)Compact, modern, good high-frequency performance±0.1% to ±5%Low to MediumLow“The art of electronics is not in the complexity of the circuits, but in the elegant simplicity of how fundamental components like resistors, capacitors, and inductors are used to achieve complex functions.” - Unknown Engineer“In the realm of circuit design, understanding the subtle nuances of component behavior, such as a resistor’s temperature coefficient or its failure modes, often separates a functional prototype from a truly robust and reliable product.” - Dr. Eleanor Vance, Senior Electronics Architect
On 2025-07-30
 info@kynix.com
 00852-6915 1330






![EK-Z7-ZC702-G Evaluation Board: Datasheet, Circuit, Features [FAQ]](https://static.kynix.net/imgs/BlogImage-v/ky_bg_head_20211123150859.jpg)
![ENC624J600-I/PT microcontroller: Datasheet, Features, Application[FAQ]](https://static.kynix.net/imgs/BlogImage-v/20230316173617653713.jpg)
![ATMEGA1280-16AU microcontroller: Datasheet, Features, Application[FAQ]](https://static.kynix.net/imgs/BlogImage-v/20230309165108141686.png)
![STM8S207CBT6 Microcontroller: Datasheet, Features, Application[FAQ]](https://static.kynix.net/imgs/BlogImage-v/20230309165213605373.png)
![2N7002P Mosfet: Datasheet, Pinout, Features [FAQ]](https://static.kynix.net/imgs/BlogImage-v/ky_bg_head_20211021173017.jpg)
![L298N Motor Driver: Datasheet, Arduino, Circuit [Video&FAQ]](https://static.kynix.net/imgs/BlogImage-v/ky_bg_head_20211021154504.jpg)
![MCP2515-I/P CAN Controller: CAD Models, Datasheet, Features [Video&FAQ]](https://static.kynix.net/imgs/BlogImage-v/ky_bg_head_20211021153456.jpg)